Data Cleaning for Data Sharing
Using R
NCME Annual Meeting
Schedule
| Time | Topic |
|---|---|
| 8:45 - 9:00 | Intro/Logistics |
| 9:00 - 9:45 | Fundamentals of Data Organization |
| 9:45 - 10:30 | Standardized Data Cleaning Checklist |
| 10:30 - 10:45 | Break |
| 10:45 - 12:30 | Data Cleaning Functions |
| 12:30 - 12:45 | Documentation for Data Sharing |
Logistics
Materials
Cghlewis.github.io/ncme-data-cleaning-workshop/
Exercises
Login to Posit Cloud workspace: https://posit.cloud/content/7872027.
If Posit Cloud doesn’t work, download materials locally:
Feel free to interrupt me with questions/comments at any time ✋.
Get up and move around as much as you need to 🚶.
About the Speaker
- Independent Research Data Management Consultant
- Previously data manager for the Missouri Prevention Science Institute
- Co-organizer for R-Ladies St. Louis
- Co-organizer for the POWER Data Management in Education Research Hub
- Author Data Management in Large-Scale Education Research

Introductions
- Your name
- Your affiliation
- Your role

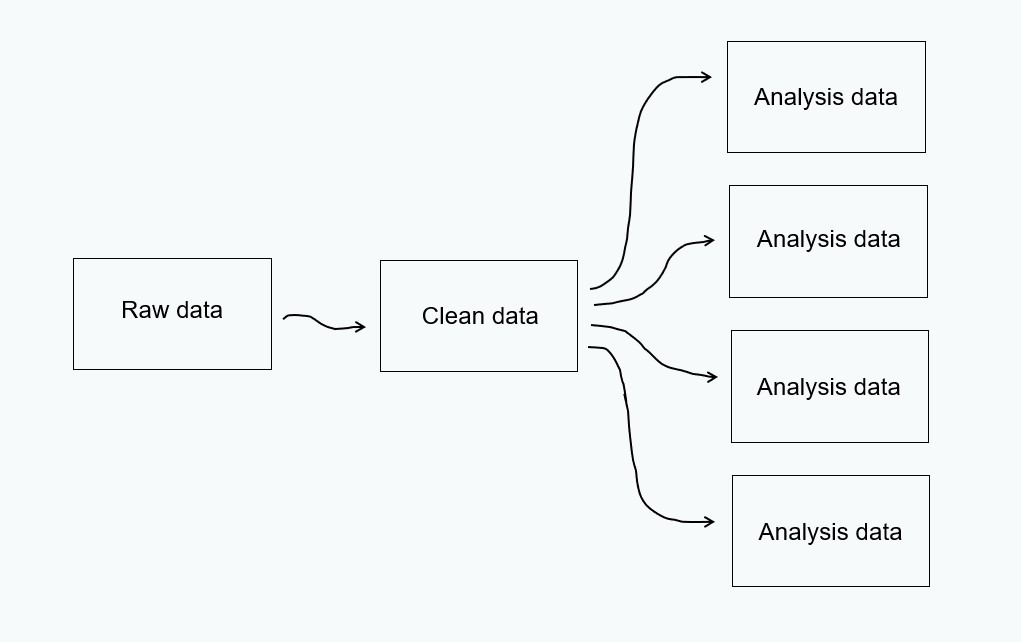
3 Phases of Data

A Sampling of Open Datasets
Learning Objectives
- Understand how to assess a data set for 7 data quality indicators
- Be able to review a data set and apply a list of standardized data cleaning steps as needed
- Feel comfortable using R code to clean a data set using our standardized steps
- Understand types of documentation that should be shared alongside data
Data Quality Indicators
The Data are Ready
7 Data Quality Indicators
Analyzable
Interpretable
Complete
Valid
Accurate
Consistent
De-identified

Analyzable
- Data should make a rectangle of rows and columns
- The first row, and only the first row, is your variable names
- The remaining data should be made up of values in cells
- At least one column uniquely defines the rows in the data (e.g., unique identifier)
Analyzable
- Column values are analyzable
- Information is explicit
Analyzable
Analyzable
- Only one piece of information is collected per variable
Exercise
What data quality issues do you detect for the analyzable indicator?
01:00
Solution
- Data does not make a rectangle
- Color coding used to convey information
- More than one piece of information in a variable
- Blank values implied to be 0 for
Q4variables
Interpretable
- Variable names should be machine-readable
- Unique
- No spaces or special characters except
_- This includes no
.or-
- This includes no
- Not begin with a number
- Character limit of 32
- Variable names should be human-readable
- Meaningful (
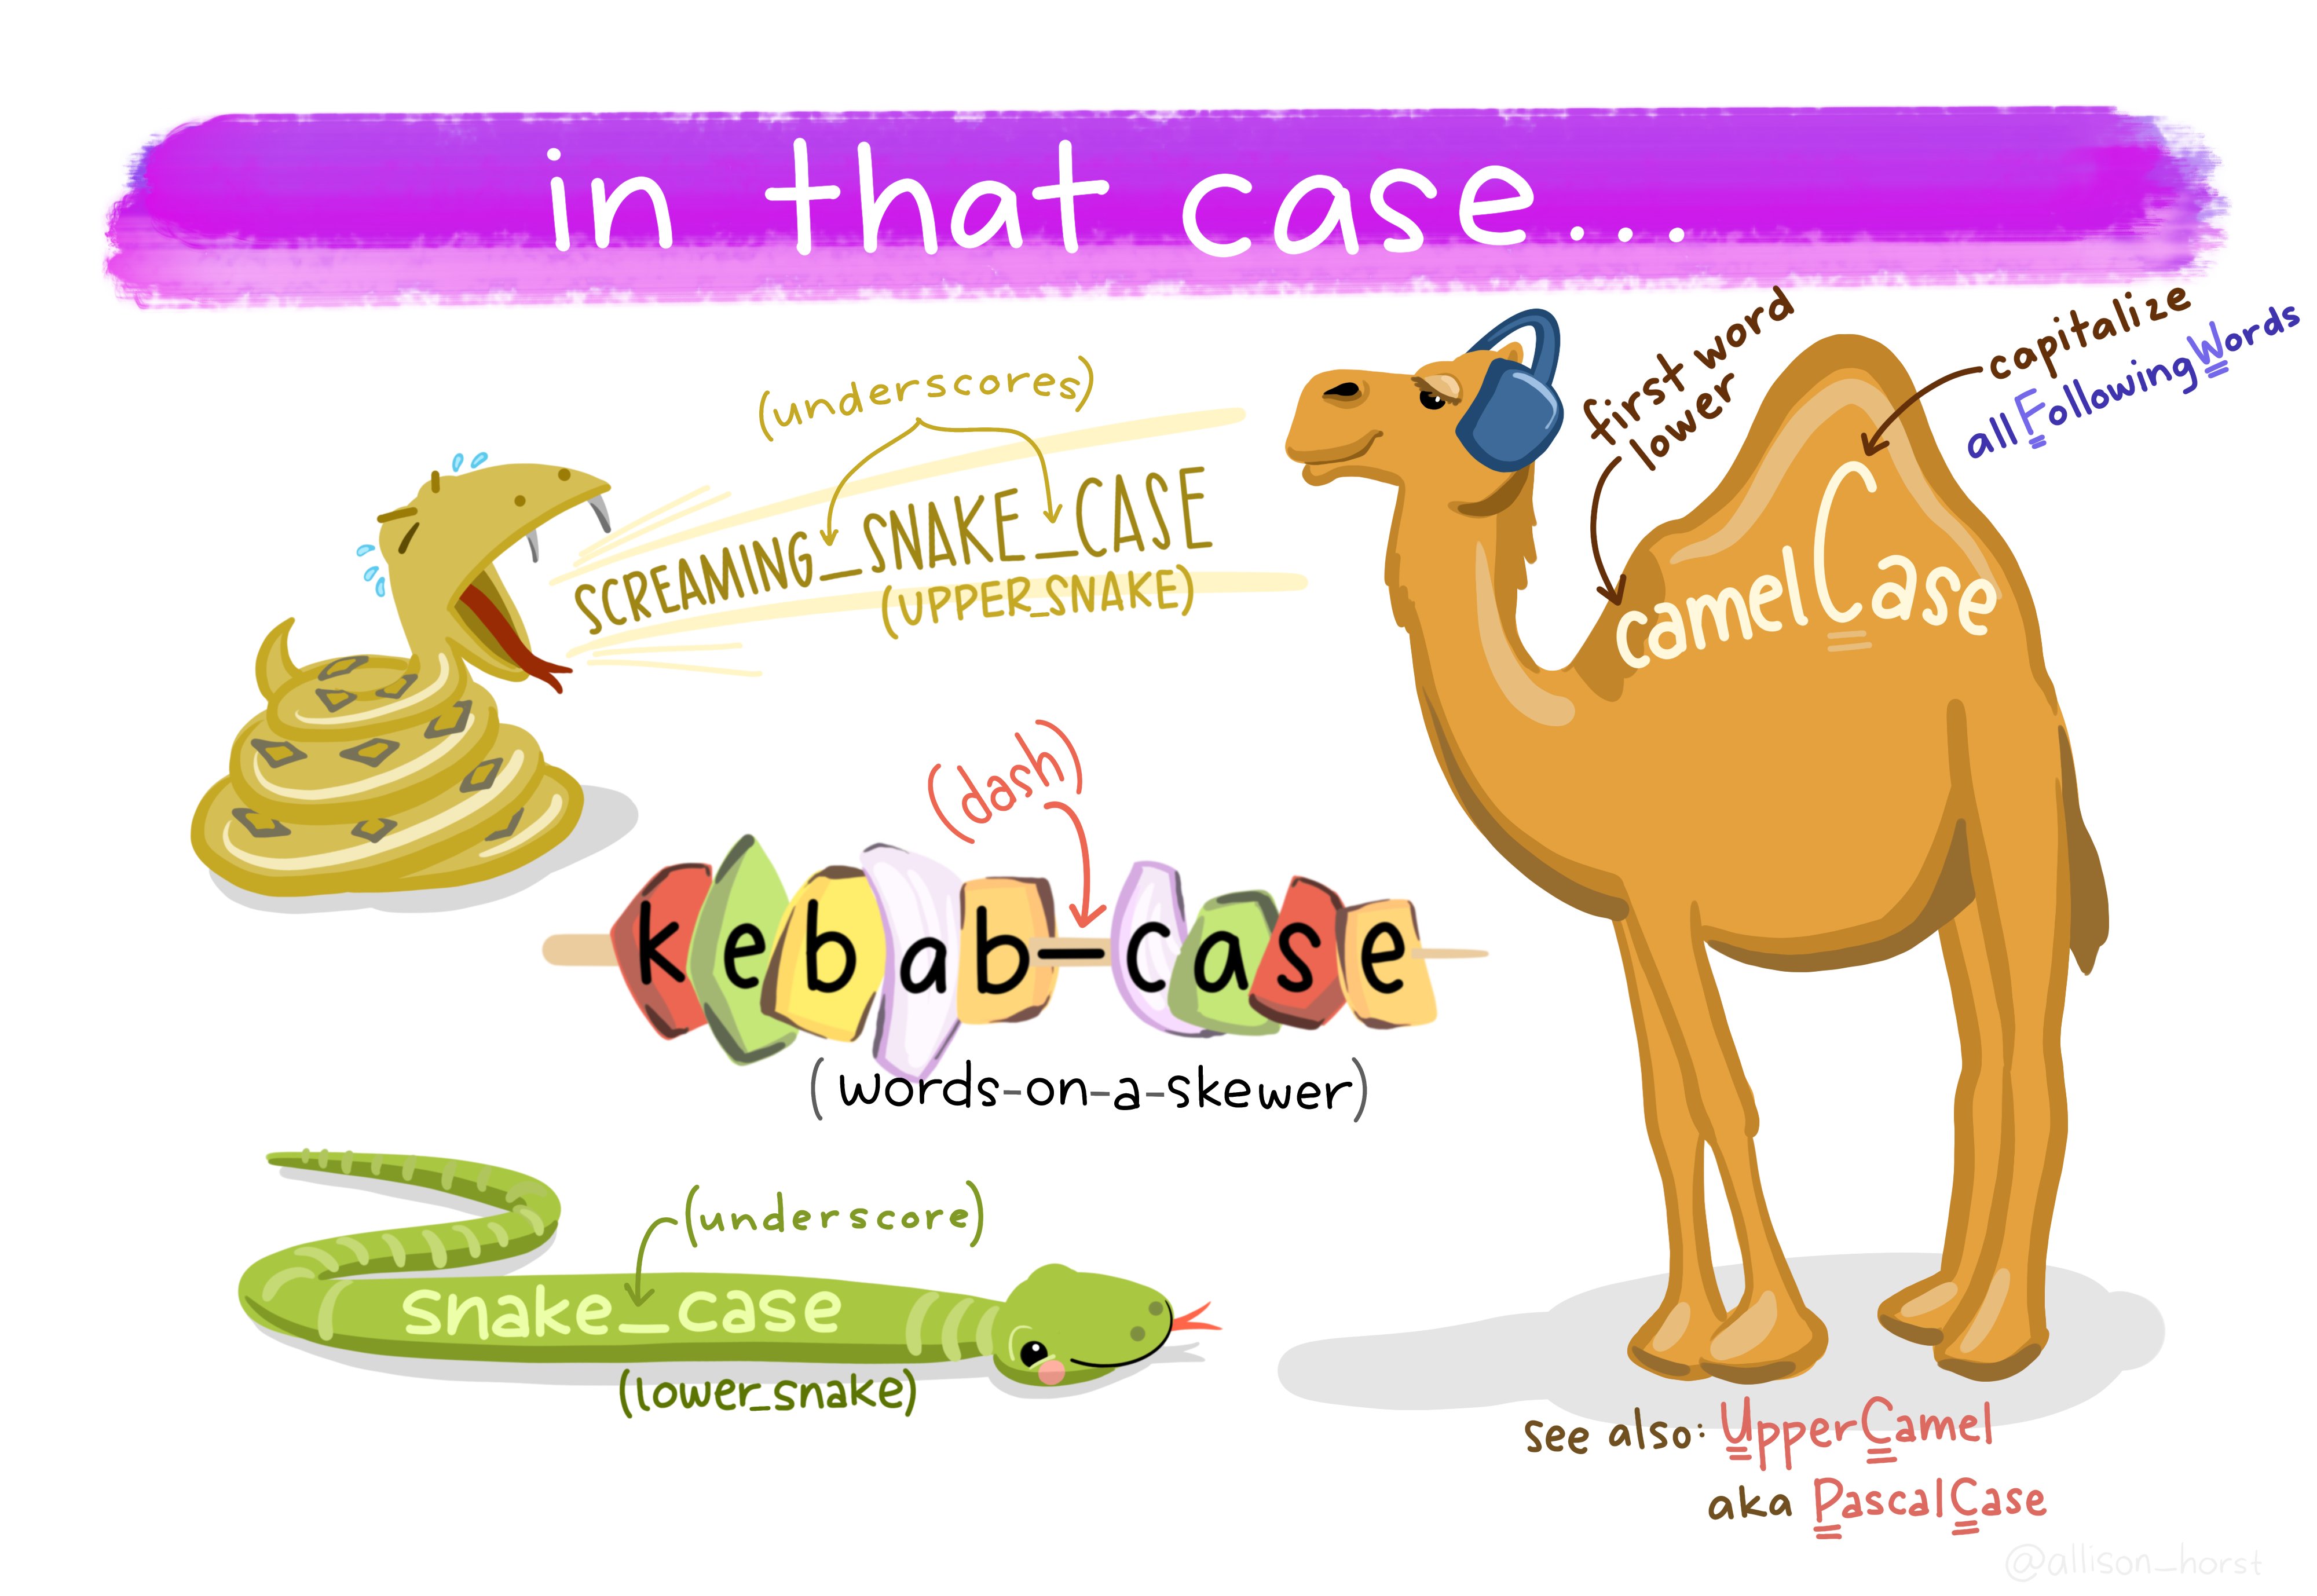
genderinstead ofQ1) - Consistently formatted (capitalization and delimiters)
- Consistent order of information
wave_responder_scale#(w1_t_mast1)
- Meaningful (

Interpretable
- When publicly sharing data, it is recommended to share data in at least one non-proprietary format (e.g., CSV)
- But if you would also like to share a copy in a commonly used format such as SPSS, SAS, or Stata, consider adding embedded metadata (i.e., variable label and value labels)
Exercise
What data quality issues do you detect for the interpretable indicator?
01:00
Solution
- Spaces and special characters used in variable names
- Some variable names are unclear
- Inconsistent use of capitalization
Complete
- Cases
- The number of rows in your dataset should total to your sample N
- No missing cases
- No duplicate cases (i.e., no unique identifier)
- The number of rows in your dataset should total to your sample N
- Variables
- The number of columns in your dataset should total to what you planned to have
- No missing variables
- No unexpected missing data
- If you collected the data, it should exist in the dataset
- The number of columns in your dataset should total to what you planned to have
Complete
Tracking Database
Data Dictionary
Exercise
What data quality issues do you detect for the complete indicator?
01:00
Solution
- The data contain a duplicate ID (104)
Valid
- Variables conform to the planned constraints
- Planned variable types (e.g.,
numeric,character,date) - Allowable variable values and ranges (e.g.,
1-5) - Item-level missingness aligns with variable universe rules and skip patterns
- Planned variable types (e.g.,
Valid
Exercise
What data quality issues do you detect for the valid indicator?
01:00
Solution
AGE/YRdoes not adhere to our planned variable type- Values in
Scorefall out of our expected range
Accurate
- Information should be accurate based on any implicit knowledge you have
- For instance, maybe you know a student is in 2nd grade because you’ve interacted with that student, but their grade level is shown as 5th in the data
- Accurate within and across sources
- A date of birth collected from school records should match the date of birth provided by the student
- If a student is in 2nd grade, they should be associated with a second grade teacher
Exercise
What data quality issues do you detect for the accurate indicator?
01:00
Solution
- ID 105 has conflicting information for
TEACHING LEVELandSCHOOL
Consistent
Variable values are consistently measured, formatted, or categorized within a column
Variables are consistently measured across collections of the same form
Exercise
What data quality issues do you detect for the consistent indicator?
01:00
Solution
- Values for
GENDERare not consistently categorized
De-identified
De-identified
- Direct identifiers are removed
De-identified
- Open-ended questions
- These variables may contain information that can directly or indirectly identify individuals
- Outliers
- If someone has extreme values for a variable, it may be easier to identify that individual
- Small cell sizes
- NCES Standard 4-2-10, suggests that all categories have at least 3 cases to minimize risk
- Combinations of variables, or crosstabs, can also create small cell-sizes
- race + gender + grade level
🚨 Consider this in the context of risk
- Math assessment may be low risk while a survey on substance use is higher risk
Exercise
What data quality issues do you detect for the de-identified indicator?
01:00
Solution
- Replace School Name with an unique ID
- Review outliers and combination of demographics to see if other alterations are necessary
Biggest Advice
The number one way to reduce data errors is to make a plan before you collect data
Correct data at the source
- Plan the variables you want to collect
- Build your data collection/entry tools in a way that follows your plan
- Test your data tools before collecting/entering data
- Check your data often during data collection/entry
Data Cleaning Checklist
Data Cleaning
Standard Data Cleaning Checklist
Import the raw data
Review the raw data
Find missing data
Adjust the sample
De-identify data
Drop irrelevant columns
Split columns
Rename variables
Normalize variables
Standardize variables
Update variable types
Recode variables
Construct new variables
Add missing values
Validate data
Save clean data
Import raw data
Review data
Find missing data
Adjust the sample
De-identify data
De-identify data
De-identify data
| Source | Resource |
|---|---|
| Alena Filip | Table 2 provides pros and cons of various de-identification methods |
| J-PAL | Table 3 provides a list of direct and indirect identifiers and recommended removal methods |
| Schatschneider, et.al | Deidentifying Data Guide |
Drop irrelevant columns
Split columns
Rename variables
Normalize variables
- Compare the variable types in your raw data to the types you expected in your data dictionary.
- Do they align? If not, what needs to be done so that they do
Standardize variables
- Are columns consistently measured, categorized, and formatted according to your data dictionary?
- If not, what needs to be done so that they are
Update variable types
Recode variables
Construct additional variables
Add missing values
Data validation
Data validation
- Complete
- Check for missing/duplicate cases
- Check Ns by groups for completeness
- Check for missing/too many columns
- Check for missing/duplicate cases
- Valid and consistent
- Check for unallowed categories/values out of range
- Check ranges by groups
- Check for invalid, non-unique, or missing study IDs
- Check for incorrect variable types/formats
- Check missing value patterns
- Check for unallowed categories/values out of range
- Accurate
- Agreement across variables
- De-identified
- All direct identifiers are removed
- All indirect identifiers managed as needed
- Interpretable
- Variables correctly named
Data validation
- Documentation errors
- Fix in documentation
- Data cleaning errors
- Fix in your cleaning process
- Data entry/export process errors
- Fix at the source and export new raw file
- True values that are inaccurate, uninterpretable, or outside of a valid range
- Leave the data as is (document the issue)
- Recode those values to designated error code
- Create data quality indicators
- Choose one source of truth for inconsistent values
- Use logical/deductive editing
Export data

Export data
When you export your files, it’s important to name them consistently and clearly.
- Follow rules similar to our variable naming rules
- Machine-readable (except now
-is allowed) - Human-readable
- A user should be able to understand what the file contains without opening it
- Machine-readable (except now
Which gives you a better idea of what is in the file? 🤔
- “Project X Full Data.csv”
- “projectx_wave1_stu_svy_clean.csv”
Creating a data cleaning plan
BREAK!

BREAK!
15:00
Cleaning in R
Objects
- If you want to save the output from something you do in R, you need to save it to an object that lives in your environment
- Objects should follow the same naming rules we discussed earlier
- If you simply want to view an output, you don’t need to save it into an object
Objects
RStudio Pane Layout
Image from RStudio User Guide
Script Files
R Script File
R Markdown File
Functions
- Anatomy of a function
- function_name(argument1, argument2, argument3, …)
- the first argument is usually an object
- You can view arguments by typing
?functionnamein your console
- function_name(argument1, argument2, argument3, …)
- Arguments usually have defaults
- For example
mean(x, trim, na.rm)- trim = 0
- na.rm = FALSE
- For example
- R has many built in (base) functions
| Function | Task |
|---|---|
| View() | View object |
| str() | Display internal structure of an object |
| c() | Combine elements |
| class() | Check the class/type of an object |
Packages
We can also use functions that live in packages that we can install onto our computer
Once installed, there are two ways to call packages
- You may see both methods used in these slides
Pipes
2014+ magrittr pipe
%>%2021+ (R \(\geq\) 4.1.0) native R pipe
|>
Isabella Velásquez’s blog post Understanding the native R pipe |> (2022)
To turn on the native pipe:
Tools → Global Options → Code → Editing → Use Native Pipe Operator
Operators
Scenario
- A team member has just collected a teacher survey and has exported a raw data file.
- They have asked you to clean the file up for the purposes of data sharing.
Exercise
Take 5 minutes to open and look at our data file.
- Log in to Posit Cloud and navigate to our project
- Open the
datafolder and download “sample_tch_svy_raw.xlsx” to view the file on your computer- To download the file, check the box next to the file and go to “More” then “Export”
- Open the data file and review it.
- Notice that there is a tab called “labels” which contains information about the current state of the variables in the dataset
05:00
Import our data
Common data importing functions
read_csv(),read_delim()from thereadrpackageread_excel()from thereadxlpackageread_sav(),read_sas(),read_dta()from thehavenpackageLearn more about importing multiple files at once here
Which function should we use to read in our sample data?🤔
Import our file
read_excel()has several arguments.- path
- Name of the file, plus folder names as needed
- “data/w1_stu_obs_raw.xlsx”
- sheet = NULL
- col_names = TRUE
- na = “”
- skip = 0
- path
- Type
?read_excel()in your console to see more arguments
Exercise
Take 2 minutes to import the data.
- Open “exercises.Rmd” in our Posit Cloud project.
- First run the “Library packages” chunk using the green arrow.
- Then navigate to Exercise 1.
- Update the first code chunk and run the code to read in the data.
- Run the second code chunk to view the data.
If you get stuck, you can open “solutions.Rmd”
02:00
Review our data
- How many rows?
- In this hypothetical situation, we assume we are not missing any cases
- However, there may be duplicates
- How many columns?
- What are the variable values and ranges? Variable types?
- How much missing data do we have?
There are several functions we can use to explore data
dplyr::glimpse()skimr::skim()base::summary()summarytools::dfSummary()Hmisc::describe()
Review our data
Exercise - Part 1
Take 3 minutes to review our data.
- Navigate to Exercise 2.
- Run the code.
- Write down any potential issues you see in the data based on our data quality criteria (analyzable, interpretable, complete, valid, accurate, consistent, de-identified).
- Note: Ignore the warning messages from
dfSummary()
03:00
Exercise - Part 2
Take 5 minutes to compare our data to our documents.
- Export and open the “sample_tch_svy_data-dictionary.xlsx” in the
docsfolder.- Compare the data dictionary to what you see in our raw data.
- What additional issues do you see when you compare the data to our data dictionary?
- Export and open the “sample_tch_svy_cleaning-plan.txt” in the
docsfolder.- How does the cleaning plan compare to the issues you wrote down?
05:00
Adjust the sample
There are two key functions we can use to both identify and remove duplicates in our data
janitor::get_dupes()- Tells you which rows contain duplicate unique identifiers, if any
dplyr::distinct()- Keeps the first instance of a duplicate unique identifier
Adjust the sample
- Replace
id_varswith your unique identifier - If you have more than one variable that uniquely identifies rows, use
c(first_name, last_name)
- Replace
id_varswith your unique identifier/s - Always add the argument .keep_all = TRUE
- But remember, this always keeps the first instance of your duplicate
- This may not always be want you want
Exercise
Take 3 minutes to check for and remove duplicates.
- Navigate to Exercise 3.
- Run the code to check for duplicates.
- Make note of the duplicate
tch_idnumber.
- Make note of the duplicate
- Run the code to remove our duplicates.
- Our documented rule is that if both surveys are complete, keep the most recently completed row.
- Run a check to make sure duplicates are removed.
- Run the code to confirm that we kept the most recent submission of the duplicate survey (“2024-04-02”).
03:00
De-identify data
The functions used here will depend on what is required.
Examples of functions you might use:
dplyr::select()to drop variablesdplyr::case_when()ordplyr::recode()to collapse categories/recode valuesdplyr::*_join()to merge in study unique IDsstringr::str_remove_all()orstringr::str_replace_all()to redact character values
For our sample data we are going to use the following.
dplyr::case_when()to recategorize names into our unique study ID values anddplyr::select()to drop identifying variables
De-identify data
- To learn more about setting default values for
case_when(), type?case_whenin your console - Note that there is a new function,
case_match(), that is worth looking in to. It reduces repetition in the syntax.
Exercise
Take 3 minutes to de-identify our data
- Navigate to Exercise 4.
- Edit and run the code to create a
sch_idvariable.- Review the new variable after it is created.
- Edit and run the code to drop our identifying variables.
- Review to make sure those variables were removed.
03:00
Rename variables
Two functions we can use to rename variables
dplyr::rename()- Commonly used to rename just a few variables
purrr::set_names()- Used to rename all of our variables
- Variables in your dataset must be ordered in the same way as in
set_names()
Exercise
Take 3 minutes to rename variables
- Navigate to Exercise 5.
- Review the current variable names.
- Edit the code to rename variables according to our data dictionary/data cleaning plan.
- Check variable names again to make sure the renaming worked.
03:00
Normalize variables
There are several functions that can help us remove unexpected values from our variables.
Some examples of those include:
stringr::str_remove_all()stringr::str_replace_all()readr::parse_number()
Say this is our data
# A tibble: 3 x 2
     id income
  <dbl> <chr>
1     1 $32,000
2     2 120000
3     3 $45,000
Normalize variables
Remove character values with stringr::str_remove_all()
# A tibble: 3 x 2
     id income
  <dbl> <chr>
1     1 32000
2     2 120000
3 3 45000 - Notice that our variable is still character type
Exercise
Take 2 minutes to normalize our tch_yrs variable
- Navigate to Exercise 6.
- Review the current values for
tch_yrs. - Edit the code to remove all non-numeric values from this variable.
- Review the new values in
tch_yrs.
02:00
Update variable type
Depending on what is needed, there are several functions we can use to change variable types.
Some examples include:
as.numeric()as.character()as.Date()- Several functions in the
lubridatepackage to assist with converting dates janitor::excel_numeric_to_date()can be very helpful at times
Update variable type
It’s important to normalize variables before converting types (especially when converting from character to numeric)
Our data without normalizing
Exercise
Take 1 minute to convert tch_yrs to numeric
- Navigate to Exercise 7.
- Review the current variable type for
tch_yrs. - Edit the code and convert the variable type to numeric.
- Review the new variable type for
tch_yrs.
01:00
Recode variables
Common functions for recoding values are
dplyr::case_when()dplyr::recode()tidyr::replace_na()
Recode variables
dplyr::across() allows you to apply the same transformation across multiple columns
- This can be used in
case_when(),recode(), orreplace_na()
This will save over existing variables.
- If you don’t want to save over the existing variables, you can add the argument .names which lives in the
dplyr::across()function. This creates new variables with new names.
Exercise
Take 2 minutes to recode variables
- Navigate to Exercise 8.
- Update the code to recode the blank values for the
gradevariables.- Check to see if the recoding worked.
- Update the code to recode the
mathanxvariable.- Check to see that the recoding worked.
02:00
Construct new variables
The most important function for constructing new variables is
dplyr::mutate()From there, other functions may be required. For today, we are going to use
rowSums()which allows us to create sum scores for each row
Exercise
Take 1 minute to construct gad_sum
- Navigate to Exercise 9.
- Update the code to calculate
gad_sum - Review summary information for the new variable.
01:00
Validate data
- Create tables of information
dplyr::count(),janitor::tabyl()
- Create graphs
ggplot2
- Calculate summary statistics
- All of the functions from “Review the data” section
- Create codebooks
codebookr,memisc,sjPlot
- Create tests that pass/fail based on a set of criteria
pointblank,validate,assertr,dataquieR
Validate data
Here we are using the pointblank package to develop some validation tests
create_agent(df) |>
  rows_distinct(columns = vars(stu_id)) |>
  col_vals_not_null(columns = vars(stu_id)) |>
  col_vals_between(columns = vars(stu_id), left = 300, right = 500, na_pass = FALSE) |>
  col_is_numeric(columns = vars(age, test_score)) |>
  col_vals_between(columns = vars(test_score), left = 0, right = 500, na_pass = TRUE) |>
  interrogate()
Exercise
Take 5 minutes to validate our data
- Navigate to Exercise 10.
- Run the validation code.
- Do all of our tests pass?
- Update the code with one more validation criteria. Run the code again.
- Do all of our tests still pass?
05:00
Export data
Similar to importing data, we have many options for exporting our data depending on the format we want to export to.
openxlsx::write.xlsx()haven::write_sav(),haven::write_dta(),haven::write_sas()readr::write_csv()- x
- The object we are exporting
- file
- The name of the new file plus any folders where you want the file to live
- na = “NA”
- x
Exercise
Take 2 minutes to export our data
- Navigate to Exercise 11.
- Update our code to export the clean data file to our “data” folder.
- Once exported, download and open the file to confirm it looks as expected.
02:00
Coding best practices
- Use a coding template
- Follow a coding style guide
- Use relative file paths
- ❌ “C:/Users/Crystal/Desktop/project/data/raw_file.csv”
- ✔️ “data/raw_file.csv”
- Write all cleaning steps in code
- Comment every step in your code
- Check all of your work throughout
- If possible, have someone else review your code
Versioning
- Version your code (“sample_tch_svy_cleaning_v01.R”)
- Version your files (“sample_tch_svy_clean_v01.csv”)
- Make notes in a changelog.
Documentation for Data Sharing
Types of documentation
- Project-level documentation
- Project summary document
- Data-level documentation
- README
- Cleaning code/Data cleaning plan
- Variable-level documentation
- Data dictionary OR
- Codebook
- Repository Metadata
✔️ Allows your data to be correctly interpreted and used
✔️ Allows your work to be reproducible
✔️ Allows your work to be findable
Project-level documentation
- Funding source
- Overview of study
- Setting and sample
- Project timeline
- Measures used
- Overview of study procedures
- Recruitment, consent, data collection
- Data preparation and processing
- Data quality monitoring, de-identification procedures, decision rules
- Appendices
- Copies of instruments, consort diagrams
Data-level documentation
README
Data Cleaning Plan
Variable-level documentation
Data dictionary
Codebook
Repository Metadata
Thank you!
🌟 Please provide feedback on this workshop using this short survey.
https://forms.gle/qVTvVgP8nafbAuXT8
🌟 Stay connected!
https://cghlewis.com/
https://www.linkedin.com/in/crystal-lewis-922b4193/
https://github.com/Cghlewis

Data Cleaning for Data Sharing // Cghlewis.github.io/ncme-data-cleaning-workshop/