class: inverse, left, middle background-image: url(img/cover2.png) # Data Management Overview: Session 3 ## Training for Schoen Research ---- ## Crystal Lewis Slides available on [<svg aria-hidden="true" role="img" viewBox="0 0 496 512" style="height:1em;width:0.97em;vertical-align:-0.125em;margin-left:auto;margin-right:auto;font-size:inherit;fill:white;overflow:visible;position:relative;"><path d="M165.9 397.4c0 2-2.3 3.6-5.2 3.6-3.3.3-5.6-1.3-5.6-3.6 0-2 2.3-3.6 5.2-3.6 3-.3 5.6 1.3 5.6 3.6zm-31.1-4.5c-.7 2 1.3 4.3 4.3 4.9 2.6 1 5.6 0 6.2-2s-1.3-4.3-4.3-5.2c-2.6-.7-5.5.3-6.2 2.3zm44.2-1.7c-2.9.7-4.9 2.6-4.6 4.9.3 2 2.9 3.3 5.9 2.6 2.9-.7 4.9-2.6 4.6-4.6-.3-1.9-3-3.2-5.9-2.9zM244.8 8C106.1 8 0 113.3 0 252c0 110.9 69.8 205.8 169.5 239.2 12.8 2.3 17.3-5.6 17.3-12.1 0-6.2-.3-40.4-.3-61.4 0 0-70 15-84.7-29.8 0 0-11.4-29.1-27.8-36.6 0 0-22.9-15.7 1.6-15.4 0 0 24.9 2 38.6 25.8 21.9 38.6 58.6 27.5 72.9 20.9 2.3-16 8.8-27.1 16-33.7-55.9-6.2-112.3-14.3-112.3-110.5 0-27.5 7.6-41.3 23.6-58.9-2.6-6.5-11.1-33.3 2.6-67.9 20.9-6.5 69 27 69 27 20-5.6 41.5-8.5 62.8-8.5s42.8 2.9 62.8 8.5c0 0 48.1-33.6 69-27 13.7 34.7 5.2 61.4 2.6 67.9 16 17.7 25.8 31.5 25.8 58.9 0 96.5-58.9 104.2-114.8 110.5 9.2 7.9 17 22.9 17 46.4 0 33.7-.3 75.4-.3 83.6 0 6.5 4.6 14.4 17.3 12.1C428.2 457.8 496 362.9 496 252 496 113.3 383.5 8 244.8 8zM97.2 352.9c-1.3 1-1 3.3.7 5.2 1.6 1.6 3.9 2.3 5.2 1 1.3-1 1-3.3-.7-5.2-1.6-1.6-3.9-2.3-5.2-1zm-10.8-8.1c-.7 1.3.3 2.9 2.3 3.9 1.6 1 3.6.7 4.3-.7.7-1.3-.3-2.9-2.3-3.9-2-.6-3.6-.3-4.3.7zm32.4 35.6c-1.6 1.3-1 4.3 1.3 6.2 2.3 2.3 5.2 2.6 6.5 1 1.3-1.3.7-4.3-1.3-6.2-2.2-2.3-5.2-2.6-6.5-1zm-11.4-14.7c-1.6 1-1.6 3.6 0 5.9 1.6 2.3 4.3 3.3 5.6 2.3 1.6-1.3 1.6-3.9 0-6.2-1.4-2.3-4-3.3-5.6-2z"/></svg>](https://cghlewis.github.io/schoen-data-mgmt-series-public/) --- # Plan for this series .pull-left[ Session 1 * ~~Data flow~~ * ~~Documentation~~ <br>  ] .pull-right[ Session 2 * ~~Creating instruments~~ * ~~Tracking data~~ * ~~Capturing and storing data~~ * ~~Preparing to clean and validate data~~ ] --- # Plan for this series .pull-left[ Session 3 * Why R? * Getting acclimated with R and RStudio * Understanding objects, functions, and packages * Code writing best practices Session 4 * Packages and functions for data wrangling ] .pull-right[ Session 5 * Setting up a reproducible syntax file * Cleaning and validating data with R Session 6 * Additional data wrangling with R <img src="img/r-project.svg" width="300px" style="display: block; margin: auto;" /> ] --- background-image: url(img/syntax.PNG) background-size: contain --- background-image: url(img/syntax2.PNG) background-size: contain --- # Why use R for Data Management? .pull-left[ * Writing syntax: - Automates your work - Allows your work to be reproducible - Facilitates collaboration - Allows others to check your work <img src="img/heartyr.gif" width="300px" style="display: block; margin: auto;" /> .center[Source: @allison_horst] ] .pull-right[ * R specifically: - **Free and open source** - Platform independent - Supportive community - Powerful packages that allow us to quickly manipulate data - It integrates well with other languages, file types, and applications - Becoming more ubiquitous in the world of education research ] --- .panelset[ .panel[.panel-name[messy_data] <table class="table table-striped" style="margin-left: auto; margin-right: auto;"> <thead> <tr> <th style="text-align:right;"> id </th> <th style="text-align:left;"> Teach Years </th> <th style="text-align:left;"> Teach grade </th> <th style="text-align:left;"> School District ID </th> </tr> </thead> <tbody> <tr> <td style="text-align:right;"> 123 </td> <td style="text-align:left;"> 12yrs </td> <td style="text-align:left;"> k </td> <td style="text-align:left;"> 50_100 </td> </tr> <tr> <td style="text-align:right;"> 234 </td> <td style="text-align:left;"> 15 </td> <td style="text-align:left;"> 2 </td> <td style="text-align:left;"> 50_100 </td> </tr> <tr> <td style="text-align:right;"> 345 </td> <td style="text-align:left;"> 22.5 </td> <td style="text-align:left;"> 1 </td> <td style="text-align:left;"> 60_102 </td> </tr> <tr> <td style="text-align:right;"> 456 </td> <td style="text-align:left;"> 4yrs </td> <td style="text-align:left;"> 2 </td> <td style="text-align:left;"> 60_102 </td> </tr> <tr> <td style="text-align:right;"> 567 </td> <td style="text-align:left;"> 5 </td> <td style="text-align:left;"> 3 </td> <td style="text-align:left;"> 60_102 </td> </tr> <tr> <td style="text-align:right;"> 678 </td> <td style="text-align:left;"> .5 </td> <td style="text-align:left;"> 4 </td> <td style="text-align:left;"> 50_100 </td> </tr> </tbody> </table> ] .panel[.panel-name[cleaning_code] ```r library(tidyverse) library(stringr) library(janitor) clean <- mess %>% # fix names clean_names() %>% # remove "yrs" from teach_years mutate(teach_years = str_remove_all(teach_years, "yrs")) %>% # make teach_years numeric and round up mutate(teach_years = ceiling(as.numeric(teach_years))) %>% # for teach_grade, recode k to 0 and make it a numeric variable mutate(teach_grade = as.numeric(recode(teach_grade, `k` = "0"))) %>% # separate school and district id separate(school_district_id, into = c("sch_id", "district_id"), sep = "_") ``` ] .panel[.panel-name[clean_data] <table class="table table-striped" style="margin-left: auto; margin-right: auto;"> <thead> <tr> <th style="text-align:right;"> id </th> <th style="text-align:right;"> teach_years </th> <th style="text-align:right;"> teach_grade </th> <th style="text-align:left;"> sch_id </th> <th style="text-align:left;"> district_id </th> </tr> </thead> <tbody> <tr> <td style="text-align:right;"> 123 </td> <td style="text-align:right;"> 12 </td> <td style="text-align:right;"> 0 </td> <td style="text-align:left;"> 50 </td> <td style="text-align:left;"> 100 </td> </tr> <tr> <td style="text-align:right;"> 234 </td> <td style="text-align:right;"> 15 </td> <td style="text-align:right;"> 2 </td> <td style="text-align:left;"> 50 </td> <td style="text-align:left;"> 100 </td> </tr> <tr> <td style="text-align:right;"> 345 </td> <td style="text-align:right;"> 23 </td> <td style="text-align:right;"> 1 </td> <td style="text-align:left;"> 60 </td> <td style="text-align:left;"> 102 </td> </tr> <tr> <td style="text-align:right;"> 456 </td> <td style="text-align:right;"> 4 </td> <td style="text-align:right;"> 2 </td> <td style="text-align:left;"> 60 </td> <td style="text-align:left;"> 102 </td> </tr> <tr> <td style="text-align:right;"> 567 </td> <td style="text-align:right;"> 5 </td> <td style="text-align:right;"> 3 </td> <td style="text-align:left;"> 60 </td> <td style="text-align:left;"> 102 </td> </tr> <tr> <td style="text-align:right;"> 678 </td> <td style="text-align:right;"> 1 </td> <td style="text-align:right;"> 4 </td> <td style="text-align:left;"> 50 </td> <td style="text-align:left;"> 100 </td> </tr> </tbody> </table> ] ] --- class: inverse, top, center # What Else Can R Do? <img src="img/r-package.PNG" width="800px" style="display: block; margin: auto;" /> Source: [<span style="color: white; ">rviews</span>](https://rviews.rstudio.com/2019/06/19/a-gentle-intro-to-tidymodels/) --- class: top, center # Analyze Data <img src="img/models.png" width="800px" height="450px" style="display: block; margin: auto;" /> .footer[Source: [statisticsglobe](https://statisticsglobe.com/extract-standard-error-t-and-p-value-from-regression-in-r)] --- class: top, center # Data Visualization <img src="img/graphs.jpg" width="800px" height="450px" style="display: block; margin: auto;" /> .footer[Source: @mohsinramay_] --- class: top, center # Mapping <img src="img/map.png" width="700px" height="450px" style="display: block; margin: auto;" /> .footer[Source: [revolutionanalytics](https://blog.revolutionanalytics.com/2012/02/creating-beautiful-maps-with-r.html)] --- class: top, center .left-column[ # Reporting ] .right-column[ <img src="img/psc.gif" width="550px" height="600px" /> ] .footer[Source: [RfortheRestofUs](https://rfortherestofus.com/consulting/)] --- class: top, center # Applications <img src="img/app.PNG" width="600px" height="425px" style="display: block; margin: auto;" /> Source: [Ashley Edwards](https://wordreadinggrowth.shinyapps.io/exposures_to_mastery/) --- class: top, center # Slide Decks <img src="img/slides.PNG" width="650px" height="475px" style="display: block; margin: auto;" /> --- class: top, center # Websites <img src="img/website.PNG" width="750px" height="475px" style="display: block; margin: auto;" /> Source: [Meghan Hall](https://meghan.rbind.io/) --- background-image: url(img/smiling_r_user.jpg) background-size: contain --- .pull-left[ <img src="img/r.PNG" width="480px" height="415px" style="display: block; margin: auto;" /> ### R is a free, open-source programming language for statistics and data visualization ] .pull-right[  ### RStudio is an integrated development environment (IDE) for R ] --- background-image: url(img/dashboard.PNG) .footnote[Source: [ModernDive](https://moderndive.com/1-getting-started.html#r-rstudio)] --- .pull-left[  ] .pull-right[ <img src="img/justRStud.PNG" width="540px" height="540px" style="display: block; margin: auto;" /> ] --- background-image: url(img/rstudio_types.PNG) background-size: contain --- background-image: url(img/cruella.gif) background-size: contain --- # Disclaimer <img src="img/r_rollercoaster.png" width="900px" height="500px" style="display: block; margin: auto;" /> --- class: inverse # Let's Get to Know R and RStudio <style> .exercise { font-size: 2em; font-style: bold } .tan{ color: #CEB888; } </style> .exercise[<svg aria-hidden="true" role="img" viewBox="0 0 384 512" style="height:1em;width:0.75em;vertical-align:-0.125em;margin-left:auto;margin-right:auto;font-size:inherit;fill:#CEB888;overflow:visible;position:relative;"><path d="M202.021 0C122.202 0 70.503 32.703 29.914 91.026c-7.363 10.58-5.093 25.086 5.178 32.874l43.138 32.709c10.373 7.865 25.132 6.026 33.253-4.148 25.049-31.381 43.63-49.449 82.757-49.449 30.764 0 68.816 19.799 68.816 49.631 0 22.552-18.617 34.134-48.993 51.164-35.423 19.86-82.299 44.576-82.299 106.405V320c0 13.255 10.745 24 24 24h72.471c13.255 0 24-10.745 24-24v-5.773c0-42.86 125.268-44.645 125.268-160.627C377.504 66.256 286.902 0 202.021 0zM192 373.459c-38.196 0-69.271 31.075-69.271 69.271 0 38.195 31.075 69.27 69.271 69.27s69.271-31.075 69.271-69.271-31.075-69.27-69.271-69.27z"/></svg> .tan[Exercises] <svg aria-hidden="true" role="img" viewBox="0 0 384 512" style="height:1em;width:0.75em;vertical-align:-0.125em;margin-left:auto;margin-right:auto;font-size:inherit;fill:#CEB888;overflow:visible;position:relative;"><path d="M202.021 0C122.202 0 70.503 32.703 29.914 91.026c-7.363 10.58-5.093 25.086 5.178 32.874l43.138 32.709c10.373 7.865 25.132 6.026 33.253-4.148 25.049-31.381 43.63-49.449 82.757-49.449 30.764 0 68.816 19.799 68.816 49.631 0 22.552-18.617 34.134-48.993 51.164-35.423 19.86-82.299 44.576-82.299 106.405V320c0 13.255 10.745 24 24 24h72.471c13.255 0 24-10.745 24-24v-5.773c0-42.86 125.268-44.645 125.268-160.627C377.504 66.256 286.902 0 202.021 0zM192 373.459c-38.196 0-69.271 31.075-69.271 69.271 0 38.195 31.075 69.27 69.271 69.27s69.271-31.075 69.271-69.271-31.075-69.27-69.271-69.27z"/></svg>] ### 1. Open R ### 2. Open RStudio ### 3. Find what version of R and RStudio that you have --- ## Tour of RStudio <img src="img/panes.PNG" width="800px" height="500px" style="display: block; margin: auto;" /> --- class: inverse background-image: url(img/reminders.PNG) background-size: 80% --- ## Source Pane <img src="img/panes2.PNG" width="800px" height="500px" style="display: block; margin: auto;" /> --- class: inverse background-image: url(img/reminders2.PNG) background-size: 80% --- class: inverse # Let's Get to Know our Settings .pull-left[ .exercise[<svg aria-hidden="true" role="img" viewBox="0 0 384 512" style="height:1em;width:0.75em;vertical-align:-0.125em;margin-left:auto;margin-right:auto;font-size:inherit;fill:#CEB888;overflow:visible;position:relative;"><path d="M202.021 0C122.202 0 70.503 32.703 29.914 91.026c-7.363 10.58-5.093 25.086 5.178 32.874l43.138 32.709c10.373 7.865 25.132 6.026 33.253-4.148 25.049-31.381 43.63-49.449 82.757-49.449 30.764 0 68.816 19.799 68.816 49.631 0 22.552-18.617 34.134-48.993 51.164-35.423 19.86-82.299 44.576-82.299 106.405V320c0 13.255 10.745 24 24 24h72.471c13.255 0 24-10.745 24-24v-5.773c0-42.86 125.268-44.645 125.268-160.627C377.504 66.256 286.902 0 202.021 0zM192 373.459c-38.196 0-69.271 31.075-69.271 69.271 0 38.195 31.075 69.27 69.271 69.27s69.271-31.075 69.271-69.271-31.075-69.27-69.271-69.27z"/></svg> .tan[Exercises] <svg aria-hidden="true" role="img" viewBox="0 0 384 512" style="height:1em;width:0.75em;vertical-align:-0.125em;margin-left:auto;margin-right:auto;font-size:inherit;fill:#CEB888;overflow:visible;position:relative;"><path d="M202.021 0C122.202 0 70.503 32.703 29.914 91.026c-7.363 10.58-5.093 25.086 5.178 32.874l43.138 32.709c10.373 7.865 25.132 6.026 33.253-4.148 25.049-31.381 43.63-49.449 82.757-49.449 30.764 0 68.816 19.799 68.816 49.631 0 22.552-18.617 34.134-48.993 51.164-35.423 19.86-82.299 44.576-82.299 106.405V320c0 13.255 10.745 24 24 24h72.471c13.255 0 24-10.745 24-24v-5.773c0-42.86 125.268-44.645 125.268-160.627C377.504 66.256 286.902 0 202.021 0zM192 373.459c-38.196 0-69.271 31.075-69.271 69.271 0 38.195 31.075 69.27 69.271 69.27s69.271-31.075 69.271-69.271-31.075-69.27-69.271-69.27z"/></svg>] ### Tools -> Global Options 1. General Options 2. Code Options 3. Appearance Options 4. Pane Layout ] .pull-right[  ] --- # Terminology <style> .yellow{ color: yellow; font-style: bold; } </style> Everything that exists in R is an **object** Recall the assignment operator .yellow[`<-`] ```r x <- 5 y <- 6 ``` Everything that happens is a **function** Consider the function .yellow[sum] ```r sum(x, y) ``` ``` [1] 11 ``` .footnote[Source: [R for the Rest of Us](https://rfortherestofus.com/courses/getting-started/)] --- # Objects .pull-left[ 1. There are 6 types of **objects** in R programming + **Vector** + Lists + Matrices + Array + Factors + **Data Frame** (Tibble) ] .pull-right[  ] --- # Objects .pull-left[ * Data Frame - Simply put, this is your dataset. A two dimensional data structure, where each column is a variable and each row is a case. - In R you can create your own dataframe or read in a dataframe from your computer, a website, or a package. - Tibble is another term you might hear ```r data <- data.frame( id = c(123, 234, 456), age = c(12, 10, 9)) data ``` ``` id age 1 123 12 2 234 10 3 456 9 ``` ] .pull-right[ * Vector - This is the simplest object - It consists of one or more elements all of the same type (ex: all numeric, all character) - Think of vector as a variable outside of a dataframe ```r id <- c(123, 234, 456) id ``` ``` [1] 123 234 456 ``` ] --- # Best Practices for Object Naming .pull-left[ 1. No spaces 2. Use all lower case 3. Use underscores to separate words 4. Descriptive 5. Not names of existing functions 6. Don't start with a number 7. No special characters ] .pull-right[ ```r # Good day_one day_1 # Bad 1_day DayOne day-one x ``` ```r # Bad T <- FALSE c <- 10 sum <- x + y ``` Source: [Advanced R](http://adv-r.had.co.nz/Style.html) ] --- # Every R Object has a Type and Class .pull-left[ #### **Type**: How an object is stored in memory 1. Character: **"apple"**, **"12_405"** 2. Double: **2**, **2.5** 3. Integer: **2L** 4. Logical: **TRUE**, **FALSE** 5. Complex: **1+4i** ] .pull-right[ #### **Class**: The abstract type 1. Character 1. Numeric 1. Integer 1. Factor 1. Date 1. POSIXct 1. Logical ] .footnote[[The Carpentries](https://swcarpentry.github.io/r-novice-inflammation/13-supp-data-structures/)] --- # Examples of Type and Class .pull-left[ ```r # Numeric vector age <- c(12, 14) class(age) ``` ``` [1] "numeric" ``` ```r typeof(age) ``` ``` [1] "double" ``` ] .pull-right[ ```r # Date birth_date <- as.Date(c("2005-01-14", "2006-07-22")) class(birth_date) ``` ``` [1] "Date" ``` ```r typeof(birth_date) ``` ``` [1] "double" ``` ] --- # Examples of Type and Class ```r # Dataframe data <- data.frame( id = c(123, 234, 456), age = c(12, 10, 9)) print(data) ``` ``` id age 1 123 12 2 234 10 3 456 9 ``` ```r class(data) ``` ``` [1] "data.frame" ``` ```r typeof(data) ``` ``` [1] "list" ``` --- # Functions .pull-left[ **Option 1:** Write your own function ```r my_sum <- function(x,y){ x + y } my_sum(x=1, y=2) ``` ``` [1] 3 ``` ] .pull-right[ **Option 2:** Use an existing function (calling a function) ```r x <- 1 y <- 2 sum(x, y) ``` ``` [1] 3 ``` ] --- # Anatomy of a Function Call <style> .large { font-size: 2em; font-style: bold; } </style> .center[.large[**function_name(arguments)**]] .pull-left[ 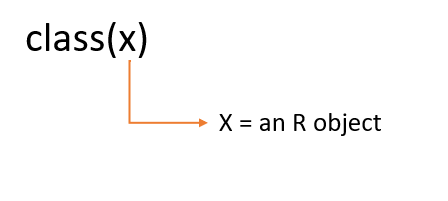 ] .pull-right[ 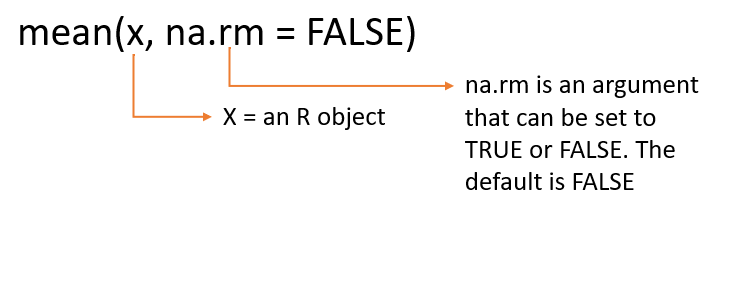 ] --- # <svg aria-hidden="true" role="img" viewBox="0 0 384 512" style="height:1em;width:0.75em;vertical-align:-0.125em;margin-left:auto;margin-right:auto;font-size:inherit;fill:#782F40;overflow:visible;position:relative;"><path d="M202.021 0C122.202 0 70.503 32.703 29.914 91.026c-7.363 10.58-5.093 25.086 5.178 32.874l43.138 32.709c10.373 7.865 25.132 6.026 33.253-4.148 25.049-31.381 43.63-49.449 82.757-49.449 30.764 0 68.816 19.799 68.816 49.631 0 22.552-18.617 34.134-48.993 51.164-35.423 19.86-82.299 44.576-82.299 106.405V320c0 13.255 10.745 24 24 24h72.471c13.255 0 24-10.745 24-24v-5.773c0-42.86 125.268-44.645 125.268-160.627C377.504 66.256 286.902 0 202.021 0zM192 373.459c-38.196 0-69.271 31.075-69.271 69.271 0 38.195 31.075 69.27 69.271 69.27s69.271-31.075 69.271-69.271-31.075-69.27-69.271-69.27z"/></svg> Let's Practice Some Base R Functions <svg aria-hidden="true" role="img" viewBox="0 0 384 512" style="height:1em;width:0.75em;vertical-align:-0.125em;margin-left:auto;margin-right:auto;font-size:inherit;fill:#782F40;overflow:visible;position:relative;"><path d="M202.021 0C122.202 0 70.503 32.703 29.914 91.026c-7.363 10.58-5.093 25.086 5.178 32.874l43.138 32.709c10.373 7.865 25.132 6.026 33.253-4.148 25.049-31.381 43.63-49.449 82.757-49.449 30.764 0 68.816 19.799 68.816 49.631 0 22.552-18.617 34.134-48.993 51.164-35.423 19.86-82.299 44.576-82.299 106.405V320c0 13.255 10.745 24 24 24h72.471c13.255 0 24-10.745 24-24v-5.773c0-42.86 125.268-44.645 125.268-160.627C377.504 66.256 286.902 0 202.021 0zM192 373.459c-38.196 0-69.271 31.075-69.271 69.271 0 38.195 31.075 69.27 69.271 69.27s69.271-31.075 69.271-69.271-31.075-69.27-69.271-69.27z"/></svg> | Task | Function | Arguments | |-------|------------|-------| |combine elements | `c` | objects | |check the class of an object | `class` | object | |check the length of a vector | `length` | object | |get the mean of values | `mean` | object, na.rm| |create a data frame | `data.frame` | vectors of the same length | |check internal structure of an object | `str`| object | <br> <br> --- class: inverse # Packages Packages are a collection of functions. They are written by a worldwide community of R users and can be downloaded for free from the internet. <img src="img/packages.PNG" width="600px" height="300px" style="display: block; margin: auto;" /> .footnote[Source: [<span style="color: white;">Modern Dive</span>](https://moderndive.com/1-getting-started.html#r-rstudio)] --- # Packages .pull-left[ #### A huge collection of packages are hosted on the internet 1. CRAN + A central repository supported by the R Foundation + **C**omprehensive **R** **A**rchive **N**etwork + These packages must meet certain quality standards, and are regularly tested + Anyone can submit their package to CRAN and have it published for broad use + https://cran.r-project.org/ #### You may also find packages in other places 2. Bioconductor 3. GitHub 4. Your own personal computer or network drive ] .pull-right[ 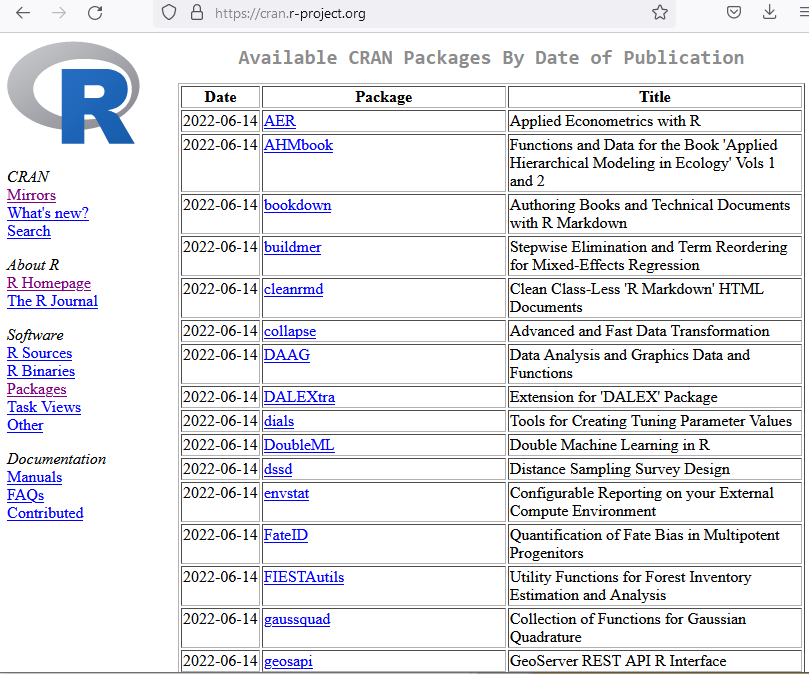 ] --- # How to Access Packages .pull-left[ #### Step 1: Install: Do only once Either install a package through code ```r install.packages("package_name") ``` Or install manually <img src="img/install.PNG" width="600px" height="275px" /> ] .pull-right[ #### Step 2: Load: Do every time you start R ```r library(package_name) library(stringr) library(dplyr) library(readr) library(haven) ``` ] --- class: inverse # Getting Help If you want to understand a package, you have several options: .pull-left[ Review the documentation. 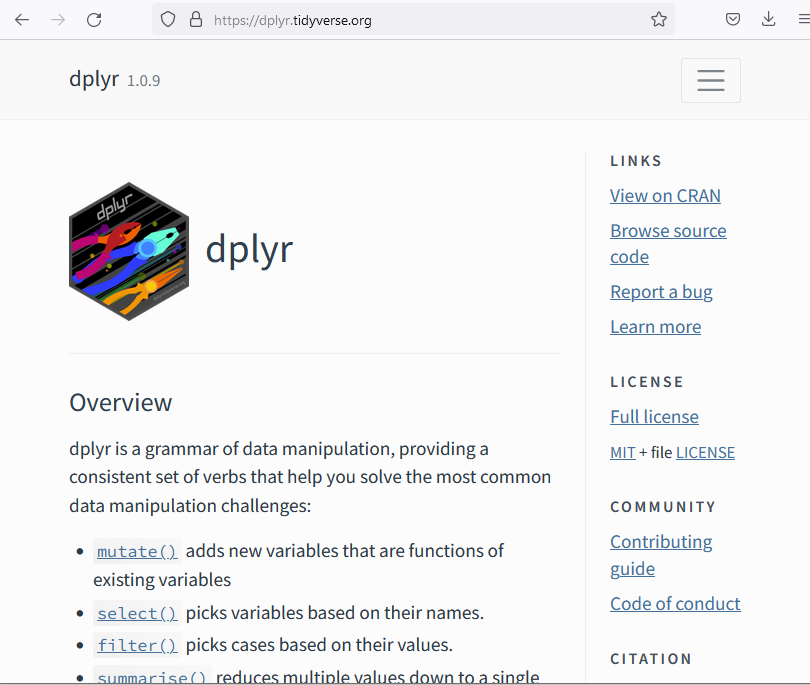 ] .pull-right[ Type .white[`?package_name`] in your console 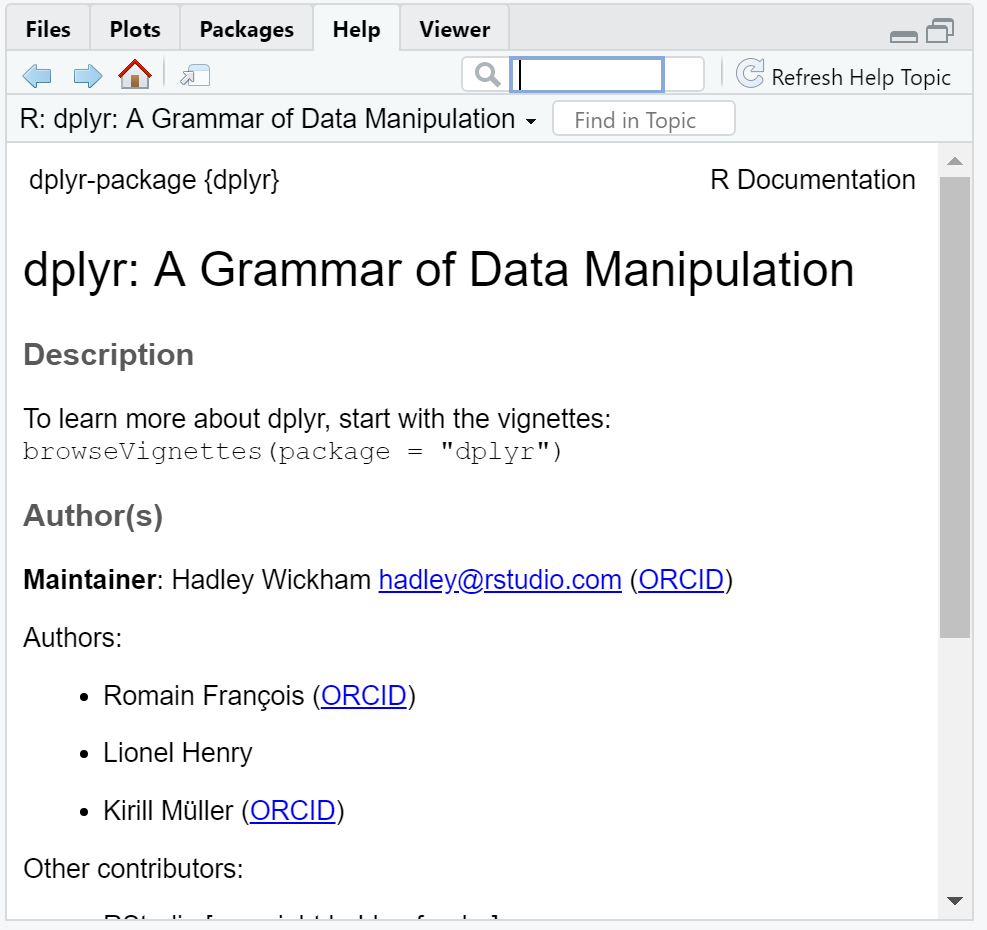 ] --- class: inverse # Getting Help in General .pull-left[ Google is your friend  ] .pull-right[ Turn to the supportive community 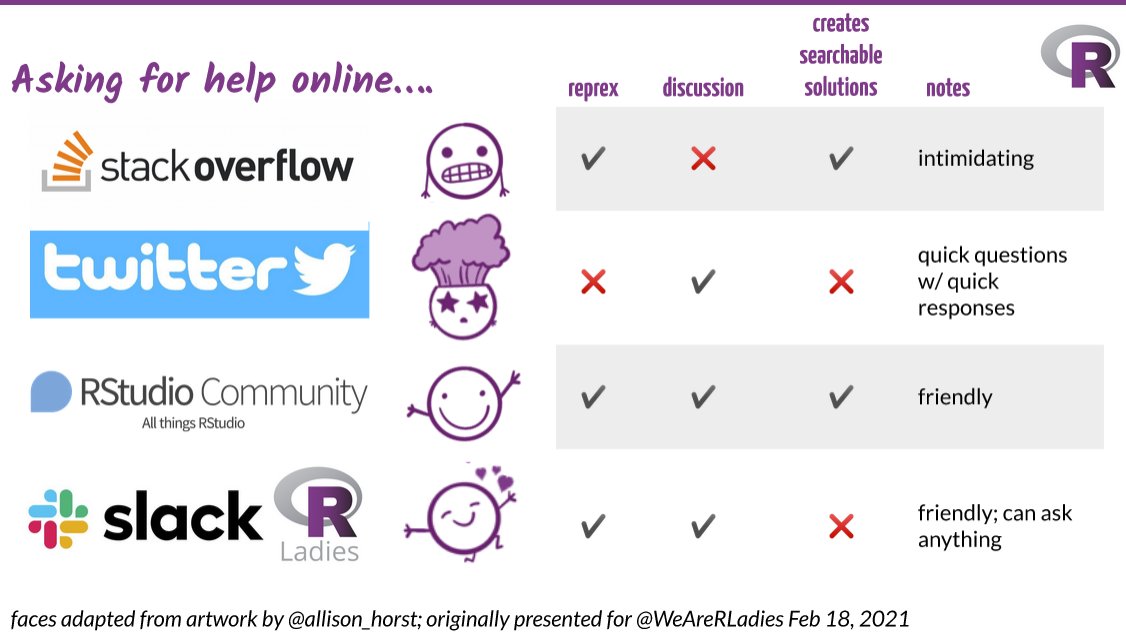 Source: [<span style="color: white;">Shannon Pileggi</span>](https://www.pipinghotdata.com/) ] --- class: inverse # Restart R Session .pull-left[  ] .pull-right[ 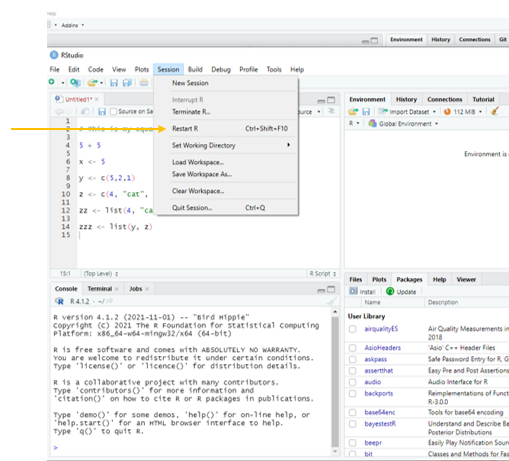 ] --- # <svg aria-hidden="true" role="img" viewBox="0 0 384 512" style="height:1em;width:0.75em;vertical-align:-0.125em;margin-left:auto;margin-right:auto;font-size:inherit;fill:#782F40;overflow:visible;position:relative;"><path d="M202.021 0C122.202 0 70.503 32.703 29.914 91.026c-7.363 10.58-5.093 25.086 5.178 32.874l43.138 32.709c10.373 7.865 25.132 6.026 33.253-4.148 25.049-31.381 43.63-49.449 82.757-49.449 30.764 0 68.816 19.799 68.816 49.631 0 22.552-18.617 34.134-48.993 51.164-35.423 19.86-82.299 44.576-82.299 106.405V320c0 13.255 10.745 24 24 24h72.471c13.255 0 24-10.745 24-24v-5.773c0-42.86 125.268-44.645 125.268-160.627C377.504 66.256 286.902 0 202.021 0zM192 373.459c-38.196 0-69.271 31.075-69.271 69.271 0 38.195 31.075 69.27 69.271 69.27s69.271-31.075 69.271-69.271-31.075-69.27-69.271-69.27z"/></svg> Let's Use our First Package <svg aria-hidden="true" role="img" viewBox="0 0 384 512" style="height:1em;width:0.75em;vertical-align:-0.125em;margin-left:auto;margin-right:auto;font-size:inherit;fill:#782F40;overflow:visible;position:relative;"><path d="M202.021 0C122.202 0 70.503 32.703 29.914 91.026c-7.363 10.58-5.093 25.086 5.178 32.874l43.138 32.709c10.373 7.865 25.132 6.026 33.253-4.148 25.049-31.381 43.63-49.449 82.757-49.449 30.764 0 68.816 19.799 68.816 49.631 0 22.552-18.617 34.134-48.993 51.164-35.423 19.86-82.299 44.576-82.299 106.405V320c0 13.255 10.745 24 24 24h72.471c13.255 0 24-10.745 24-24v-5.773c0-42.86 125.268-44.645 125.268-160.627C377.504 66.256 286.902 0 202.021 0zM192 373.459c-38.196 0-69.271 31.075-69.271 69.271 0 38.195 31.075 69.27 69.271 69.27s69.271-31.075 69.271-69.271-31.075-69.27-69.271-69.27z"/></svg> .pull-left[ 1. Open a script 2. Install a package + `readr` 3. Library a package + `library(readr)` 4. Use a function from that package + `read_csv()` + To read in this seattle pet names data from a website: https://raw.githubusercontent.com/rfordatascience/tidytuesday/master/data/2019/2019-03-26/seattle_pets.csv ] .pull-right[ ```r # Install readr package install.packages("readr") # Library package library(readr) # Read in data using readr and assign to an object pet_names <- read_csv("https://raw.githubusercontent.com/rfordatascience/tidytuesday/master/data/2019/2019-03-26/seattle_pets.csv") ``` ] --- # General Code Writing Best Practices 1. Comment your code + Comments begin with `#` and a space + Comments should explain what and why something is happening ```r # Load raw data # Drop duplicates cases from raw data ``` 2\. Add sections to further refine your comments and make your file more searchable + Sections can be added by using 4 dashes after your comment `----` + You can also add sections by going to - Code -> Insert Section ```r # Load raw data ---- # (1) Read in the data # (2) Review the data ``` --- # General Code Writing Best Practices 3\. Use spacing + Place spacing around all operators (**except** the colon) + Do not put spaces inside or outside parentheses for regular function calls ```r # Good average <- mean(feet / 12 + inches, na.rm = TRUE) x <- 1:10 mean(x, na.rm = TRUE) # Bad average<-mean(feet/12+inches,na.rm=TRUE) x <- 1 : 10 mean (x, na.rm = TRUE) mean( x, na.rm = TRUE ) ``` --- # General Code Writing Best Practices 4\. Function-indent long lines + Strive to limit your code to 80 characters per line + If a function call is too long, place each argument on its own line ```r do_something_very_complicated( something = "that", requires = many, arguments = "some of which may be long" ) ``` .footnote[Source: [Tidyverse Style Guide](https://style.tidyverse.org/syntax.html) and [Advanced R](http://adv-r.had.co.nz/Style.html)] --- # Shortcuts | Task | Windows | Mac | |-------|------------|-------| |Run current line of code | `Ctrl + Enter` | `Cmd + Return` | |Run all lines of code | ` Ctrl + A + Enter` | `Cmd + A + Enter` | |Code completion | `Tab` | `Tab`| |Insert assignment operator | `Alt + -` | `Option + -` | |Insert pipe operator | `Ctrl + Shift + M` | `Cmd + Shift + M` | |Comment or uncomment a line | `Ctrl + Shift + C` | `Cmd + Shift + C`| |Restart R Session | `Ctrl + Shift + F10` | `Cmd + Shift + F10` |Multi-line cursor| `Alt + click and drag` | `Option + click and drag`| |Previous command in console | `up-arrow` | `up-arrow` | --- # <svg aria-hidden="true" role="img" viewBox="0 0 384 512" style="height:1em;width:0.75em;vertical-align:-0.125em;margin-left:auto;margin-right:auto;font-size:inherit;fill:#782F40;overflow:visible;position:relative;"><path d="M202.021 0C122.202 0 70.503 32.703 29.914 91.026c-7.363 10.58-5.093 25.086 5.178 32.874l43.138 32.709c10.373 7.865 25.132 6.026 33.253-4.148 25.049-31.381 43.63-49.449 82.757-49.449 30.764 0 68.816 19.799 68.816 49.631 0 22.552-18.617 34.134-48.993 51.164-35.423 19.86-82.299 44.576-82.299 106.405V320c0 13.255 10.745 24 24 24h72.471c13.255 0 24-10.745 24-24v-5.773c0-42.86 125.268-44.645 125.268-160.627C377.504 66.256 286.902 0 202.021 0zM192 373.459c-38.196 0-69.271 31.075-69.271 69.271 0 38.195 31.075 69.27 69.271 69.27s69.271-31.075 69.271-69.271-31.075-69.27-69.271-69.27z"/></svg> Let's Practice Shortcuts <svg aria-hidden="true" role="img" viewBox="0 0 384 512" style="height:1em;width:0.75em;vertical-align:-0.125em;margin-left:auto;margin-right:auto;font-size:inherit;fill:#782F40;overflow:visible;position:relative;"><path d="M202.021 0C122.202 0 70.503 32.703 29.914 91.026c-7.363 10.58-5.093 25.086 5.178 32.874l43.138 32.709c10.373 7.865 25.132 6.026 33.253-4.148 25.049-31.381 43.63-49.449 82.757-49.449 30.764 0 68.816 19.799 68.816 49.631 0 22.552-18.617 34.134-48.993 51.164-35.423 19.86-82.299 44.576-82.299 106.405V320c0 13.255 10.745 24 24 24h72.471c13.255 0 24-10.745 24-24v-5.773c0-42.86 125.268-44.645 125.268-160.627C377.504 66.256 286.902 0 202.021 0zM192 373.459c-38.196 0-69.271 31.075-69.271 69.271 0 38.195 31.075 69.27 69.271 69.27s69.271-31.075 69.271-69.271-31.075-69.27-69.271-69.27z"/></svg> <img src="img/shortcuts.PNG" width="600px" height="500px" style="display: block; margin: auto;" /> .footnote[Source: [Zenkit](https://zenkit.com/en/blog/shortcuts-for-all/)] --- class: inverse, center, middle # Questions?