class: inverse, left, middle background-image: url(img/cover2.png) # Data Management Overview: Session 4 ## Training for Schoen Research ---- ## Crystal Lewis Slides available on [<svg aria-hidden="true" role="img" viewBox="0 0 496 512" style="height:1em;width:0.97em;vertical-align:-0.125em;margin-left:auto;margin-right:auto;font-size:inherit;fill:white;overflow:visible;position:relative;"><path d="M165.9 397.4c0 2-2.3 3.6-5.2 3.6-3.3.3-5.6-1.3-5.6-3.6 0-2 2.3-3.6 5.2-3.6 3-.3 5.6 1.3 5.6 3.6zm-31.1-4.5c-.7 2 1.3 4.3 4.3 4.9 2.6 1 5.6 0 6.2-2s-1.3-4.3-4.3-5.2c-2.6-.7-5.5.3-6.2 2.3zm44.2-1.7c-2.9.7-4.9 2.6-4.6 4.9.3 2 2.9 3.3 5.9 2.6 2.9-.7 4.9-2.6 4.6-4.6-.3-1.9-3-3.2-5.9-2.9zM244.8 8C106.1 8 0 113.3 0 252c0 110.9 69.8 205.8 169.5 239.2 12.8 2.3 17.3-5.6 17.3-12.1 0-6.2-.3-40.4-.3-61.4 0 0-70 15-84.7-29.8 0 0-11.4-29.1-27.8-36.6 0 0-22.9-15.7 1.6-15.4 0 0 24.9 2 38.6 25.8 21.9 38.6 58.6 27.5 72.9 20.9 2.3-16 8.8-27.1 16-33.7-55.9-6.2-112.3-14.3-112.3-110.5 0-27.5 7.6-41.3 23.6-58.9-2.6-6.5-11.1-33.3 2.6-67.9 20.9-6.5 69 27 69 27 20-5.6 41.5-8.5 62.8-8.5s42.8 2.9 62.8 8.5c0 0 48.1-33.6 69-27 13.7 34.7 5.2 61.4 2.6 67.9 16 17.7 25.8 31.5 25.8 58.9 0 96.5-58.9 104.2-114.8 110.5 9.2 7.9 17 22.9 17 46.4 0 33.7-.3 75.4-.3 83.6 0 6.5 4.6 14.4 17.3 12.1C428.2 457.8 496 362.9 496 252 496 113.3 383.5 8 244.8 8zM97.2 352.9c-1.3 1-1 3.3.7 5.2 1.6 1.6 3.9 2.3 5.2 1 1.3-1 1-3.3-.7-5.2-1.6-1.6-3.9-2.3-5.2-1zm-10.8-8.1c-.7 1.3.3 2.9 2.3 3.9 1.6 1 3.6.7 4.3-.7.7-1.3-.3-2.9-2.3-3.9-2-.6-3.6-.3-4.3.7zm32.4 35.6c-1.6 1.3-1 4.3 1.3 6.2 2.3 2.3 5.2 2.6 6.5 1 1.3-1.3.7-4.3-1.3-6.2-2.2-2.3-5.2-2.6-6.5-1zm-11.4-14.7c-1.6 1-1.6 3.6 0 5.9 1.6 2.3 4.3 3.3 5.6 2.3 1.6-1.3 1.6-3.9 0-6.2-1.4-2.3-4-3.3-5.6-2z"/></svg>](https://cghlewis.github.io/schoen-data-mgmt-series-public/) --- # Plan for this series .pull-left[ Session 3 * ~~Why R?~~ * ~~Getting acclimated with R and RStudio~~ * ~~Understanding objects, functions, and packages~~ * ~~Code writing best practices~~ Session 4 * Packages and functions for data wrangling ] .pull-right[ Session 5 * Setting up a reproducible syntax file * Cleaning and validating data with R Session 6 * Additional data wrangling with R <img src="img/r-project.svg" width="300px" style="display: block; margin: auto;" /> ] --- class: inverse, center, middle # Recap --- background-image: url(img/where_to_code.PNG) --- .pull-left[ ## Not assigned to an object  ] .pull-right[ ## Assigned to an object  ] --- # Recap Objects .pull-left[Everything that exists in R is an **object**] .pull-right[We create objects in R by using the **<-**] .pull-left[ * Data Frame/Tibble ```r data <- data.frame( id = c(123, 234, 456), age = c(12, 10, 9)) data ``` ``` id age 1 123 12 2 234 10 3 456 9 ``` ] .pull-right[ * Vector ```r test_score <- c(10, 20, 15) test_score ``` ``` [1] 10 20 15 ``` ```r x <- 5 x ``` ``` [1] 5 ``` ] --- # Object Type and Class .pull-left[ 1. **Type**: How an object is stored in memory 2. **Class**: The abstract type * Character * Numeric * Integer * Factor * Date * POSIXct * Logical ] .pull-right[ #### As a user, we care about **CLASS** 1. Certain functions require objects to be of a particular class * Ex: The `mean()` function requires an R object that is numeric, logical or date. It cannot work with an object that is character. 2. Class is how we see and interact with the object ] .pull-left[ ```r birth_date <- as.Date(c("2005-01-14", "2006-07-22")) typeof(birth_date) ``` ``` [1] "double" ``` ] .pull-right[ ```r class(birth_date) ``` ``` [1] "Date" ``` ] --- # Recap Functions .pull-left[ Everything that happens is a **function** Anatomy of a function: **function_name(arguments)** Typically your first argument is to declare an **object** - There may be additional arguments that take statements like TRUE or FALSE or a number Type`?functionname` in console to learn more about a function ] .pull-right[ Ex: `head(x = object, n = integer)` ```r head(x = data, head = 3L) ``` ``` id age 1 123 12 2 234 10 3 456 9 ``` ] --- # Recap Functions .pull-left[ `c(objects)` ```r # create numeric vector test_score <- c(20, 30, 40, NA) #create numeric vector id <- c(10, 11, 12, 13) # create character vector fav_color <- c("green", "black", "blue", "violet") # create character vector grade_level <- c("k", 1, 2, 1) ``` ] .pull-right[ `class(object)` `length(object)` `mean(object, na.rm = FALSE)` ```r # check class of test_score class(test_score) # check length of test_score length(test_score) # get mean of test_score, remove NA values mean(test_score, na.rm = TRUE) ``` ] --- # Recap Functions .pull-left[ ```r id ``` ``` [1] 10 11 12 13 ``` ```r grade_level ``` ``` [1] "k" "1" "2" "1" ``` ```r test_score ``` ``` [1] 20 30 40 NA ``` ```r fav_color ``` ``` [1] "green" "black" "blue" "violet" ``` ] .pull-right[ ```r # create a data frame sch_data <- data.frame(id, grade_level, test_score, fav_color) ``` ``` id grade_level test_score fav_color 1 10 k 20 green 2 11 1 30 black 3 12 2 40 blue 4 13 1 NA violet ``` ```r str(sch_data) ``` ``` *'data.frame': 4 obs. of 4 variables: $ id : num 10 11 12 13 $ grade_level: chr "k" "1" "2" "1" $ test_score : num 20 30 40 NA $ fav_color : chr "green" "black" "blue" "violet" ``` ] --- class: inverse .left-column[ # Recap Packages ] .right-column[  ] --- class: inverse .left-column[ # Recap Packages ] .right-column[  ] --- class: inverse .pull-left[ <img src="img/seattle.PNG" width="650px" height="500px" /> ] .pull-right[ <img src="img/csv_file2.PNG" width="650px" height="500px" /> ] --- class: inverse .pull-left[ ```r # Install readr package # Never do this again install.packages("readr") # Library package library(readr) # Read in data using readr and # assign to an object pet_names <- read_csv( "https://raw.githubusercontent.com/ rfordatascience/tidytuesday/master/ data/2019/2019-03-26/seattle_pets.csv") ``` ] .pull-right[ 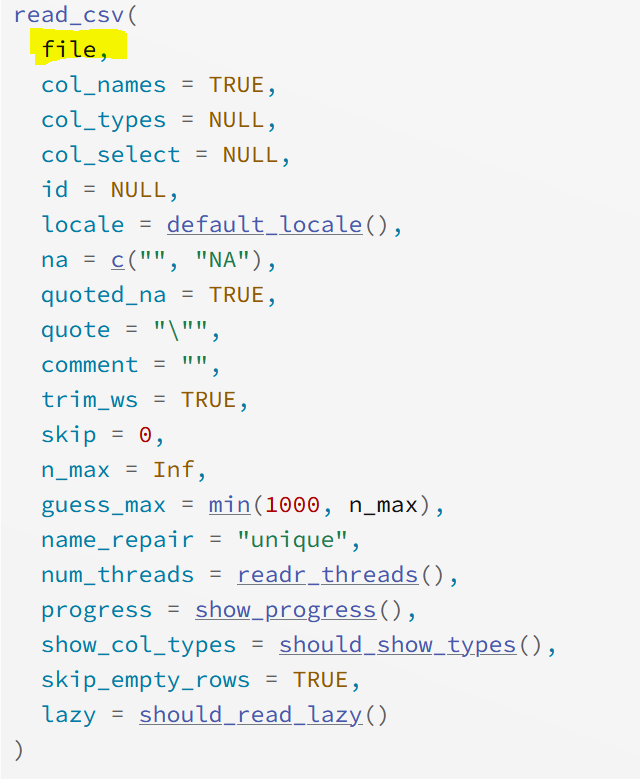 ] --- background-image: url(img/pet_names.PNG) class: inverse --- # Recap Packages ```r names(pet_names) ``` ``` [1] "license_issue_date" "license_number" "animals_name" [4] "species" "primary_breed" "secondary_breed" [7] "zip_code" ``` ```r head(pet_names) ``` ``` # A tibble: 6 x 7 license_issue_date license_number animals_name species prima~1 secon~2 zip_c~3 <chr> <chr> <chr> <chr> <chr> <chr> <chr> 1 November 16 2018 8002756 Wall-E Dog Mixed ~ Mix 98108 2 November 11 2018 S124529 Andre Dog Terrie~ Dachsh~ 98117 3 November 21 2018 903793 Mac Dog Retrie~ <NA> 98136 4 November 23 2018 824666 Melb Cat Domest~ <NA> 98117 5 December 30 2018 S119138 Gingersnap Cat Domest~ Mix 98144 6 December 16 2018 S138529 Cody Dog Retrie~ <NA> 98103 *# ... with abbreviated variable names 1: primary_breed, 2: secondary_breed, # 3: zip_code ``` --- # Recap Packages ```r str(pet_names) ``` ``` *spc_tbl_ [52,519 x 7] (S3: spec_tbl_df/tbl_df/tbl/data.frame) $ license_issue_date: chr [1:52519] "November 16 2018" "November 11 2018" "November 21 2018" "November 23 2018" ... $ license_number : chr [1:52519] "8002756" "S124529" "903793" "824666" ... $ animals_name : chr [1:52519] "Wall-E" "Andre" "Mac" "Melb" ... $ species : chr [1:52519] "Dog" "Dog" "Dog" "Cat" ... $ primary_breed : chr [1:52519] "Mixed Breed, Medium (up to 44 lbs fully grown)" "Terrier, Jack Russell" "Retriever, Labrador" "Domestic Shorthair" ... $ secondary_breed : chr [1:52519] "Mix" "Dachshund, Standard Wire Haired" NA NA ... $ zip_code : chr [1:52519] "98108" "98117" "98136" "98117" ... - attr(*, "spec")= .. cols( .. license_issue_date = col_character(), .. license_number = col_character(), .. animals_name = col_character(), .. species = col_character(), .. primary_breed = col_character(), .. secondary_breed = col_character(), .. zip_code = col_character() .. ) - attr(*, "problems")=<externalptr> ``` --- # Recap Packages ```r print(pet_names) ``` ``` *# A tibble: 52,519 x 7 license_issue_date license_number animals_n~1 species prima~2 secon~3 zip_c~4 * <chr> <chr> <chr> <chr> <chr> <chr> <chr> 1 November 16 2018 8002756 Wall-E Dog Mixed ~ Mix 98108 2 November 11 2018 S124529 Andre Dog Terrie~ Dachsh~ 98117 3 November 21 2018 903793 Mac Dog Retrie~ <NA> 98136 4 November 23 2018 824666 Melb Cat Domest~ <NA> 98117 5 December 30 2018 S119138 Gingersnap Cat Domest~ Mix 98144 6 December 16 2018 S138529 Cody Dog Retrie~ <NA> 98103 7 October 04 2017 580652 Millie Dog Terrie~ <NA> 98115 8 August 09 2018 S142558 Sebastian Cat Domest~ Mix 98122 9 August 20 2018 S142546 Madeline Cat Domest~ Mix 98105 10 December 08 2018 S123830 Cleo Cat Domest~ <NA> 98199 # ... with 52,509 more rows, and abbreviated variable names 1: animals_name, # 2: primary_breed, 3: secondary_breed, 4: zip_code ``` --- # Recap Packages ```r View(pet_names) ``` 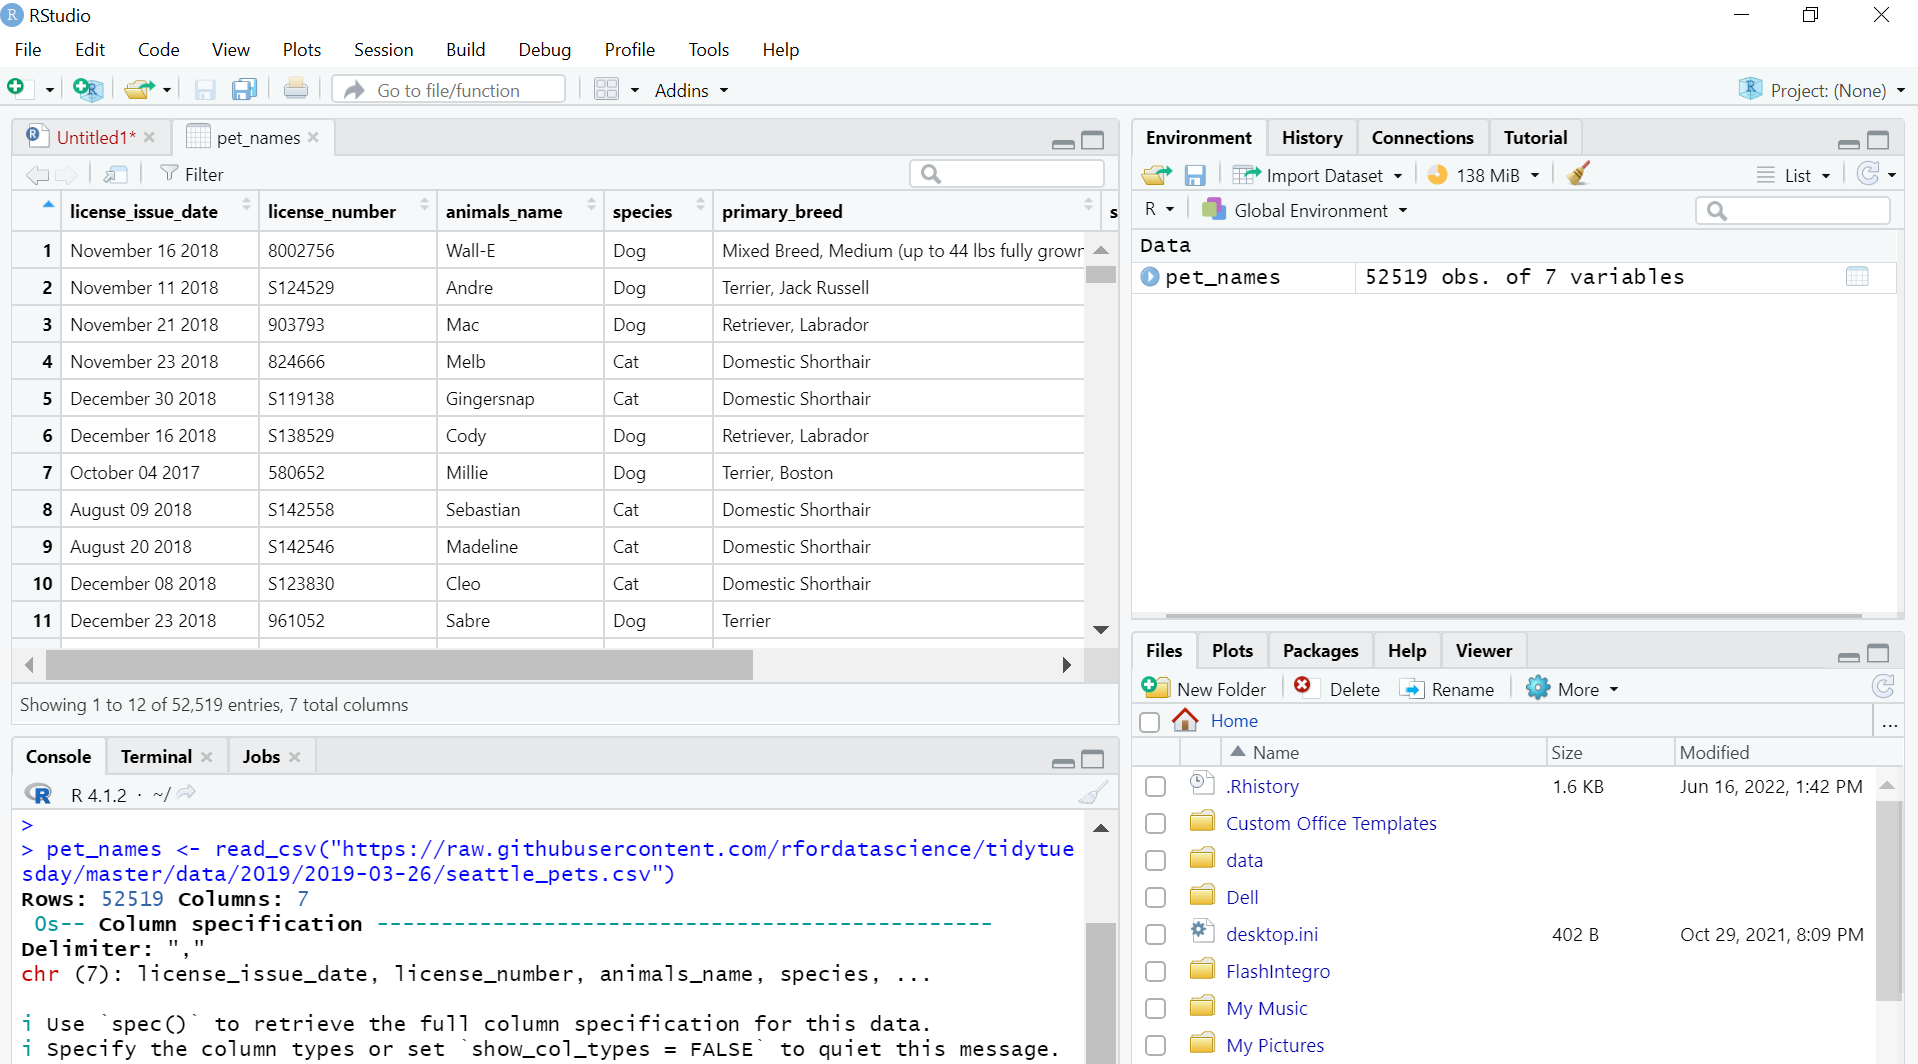 --- class: middle, center background-image: url(img/packages2.jpg) background-size: cover # .white[Packages] --- class: center # Tidyverse **An opinionated collection of R packages designed for data science** **All packages share an underlying design philosophy, grammar, and data structures**    .left[.footnote[Source: [Tidyverse packages](https://www.tidyverse.org/packages/)]] --- # Benefits to Tidyverse .pull-left[ 1. <span style = 'font-size: 150%;'><svg aria-hidden="true" role="img" viewBox="0 0 512 512" style="height:1em;width:1em;vertical-align:-0.125em;margin-left:auto;margin-right:auto;font-size:inherit;fill:#782F40;overflow:visible;position:relative;"><path d="M173.898 439.404l-166.4-166.4c-9.997-9.997-9.997-26.206 0-36.204l36.203-36.204c9.997-9.998 26.207-9.998 36.204 0L192 312.69 432.095 72.596c9.997-9.997 26.207-9.997 36.204 0l36.203 36.204c9.997 9.997 9.997 26.206 0 36.204l-294.4 294.401c-9.998 9.997-26.207 9.997-36.204-.001z"/></svg></span> Consistency 2. <span style = 'font-size: 150%;'><svg aria-hidden="true" role="img" viewBox="0 0 384 512" style="height:1em;width:0.75em;vertical-align:-0.125em;margin-left:auto;margin-right:auto;font-size:inherit;fill:#782F40;overflow:visible;position:relative;"><path d="M202.021 0C122.202 0 70.503 32.703 29.914 91.026c-7.363 10.58-5.093 25.086 5.178 32.874l43.138 32.709c10.373 7.865 25.132 6.026 33.253-4.148 25.049-31.381 43.63-49.449 82.757-49.449 30.764 0 68.816 19.799 68.816 49.631 0 22.552-18.617 34.134-48.993 51.164-35.423 19.86-82.299 44.576-82.299 106.405V320c0 13.255 10.745 24 24 24h72.471c13.255 0 24-10.745 24-24v-5.773c0-42.86 125.268-44.645 125.268-160.627C377.504 66.256 286.902 0 202.021 0zM192 373.459c-38.196 0-69.271 31.075-69.271 69.271 0 38.195 31.075 69.27 69.271 69.27s69.271-31.075 69.271-69.271-31.075-69.27-69.271-69.27z"/></svg></span> Intuitive 3. <span style = 'font-size: 150%;'><svg aria-hidden="true" role="img" viewBox="0 0 384 512" style="height:1em;width:0.75em;vertical-align:-0.125em;margin-left:auto;margin-right:auto;font-size:inherit;fill:#782F40;overflow:visible;position:relative;"><path d="M224 136V0H24C10.7 0 0 10.7 0 24v464c0 13.3 10.7 24 24 24h336c13.3 0 24-10.7 24-24V160H248c-13.2 0-24-10.8-24-24zm160-14.1v6.1H256V0h6.1c6.4 0 12.5 2.5 17 7l97.9 98c4.5 4.5 7 10.6 7 16.9z"/></svg></span> Great documentation! 4. <span style = 'font-size: 150%;'><svg aria-hidden="true" role="img" viewBox="0 0 512 512" style="height:1em;width:1em;vertical-align:-0.125em;margin-left:auto;margin-right:auto;font-size:inherit;fill:#782F40;overflow:visible;position:relative;"><path d="M256 8C119.033 8 8 119.033 8 256s111.033 248 248 248 248-111.033 248-248S392.967 8 256 8zm173.696 119.559l-63.399 63.399c-10.987-18.559-26.67-34.252-45.255-45.255l63.399-63.399a218.396 218.396 0 0 1 45.255 45.255zM256 352c-53.019 0-96-42.981-96-96s42.981-96 96-96 96 42.981 96 96-42.981 96-96 96zM127.559 82.304l63.399 63.399c-18.559 10.987-34.252 26.67-45.255 45.255l-63.399-63.399a218.372 218.372 0 0 1 45.255-45.255zM82.304 384.441l63.399-63.399c10.987 18.559 26.67 34.252 45.255 45.255l-63.399 63.399a218.396 218.396 0 0 1-45.255-45.255zm302.137 45.255l-63.399-63.399c18.559-10.987 34.252-26.67 45.255-45.255l63.399 63.399a218.403 218.403 0 0 1-45.255 45.255z"/></svg></span> Great, supportive community! 5. <span style = 'font-size: 150%;'><svg aria-hidden="true" role="img" viewBox="0 0 512 512" style="height:1em;width:1em;vertical-align:-0.125em;margin-left:auto;margin-right:auto;font-size:inherit;fill:#782F40;overflow:visible;position:relative;"><path d="M288 39.056v16.659c0 10.804 7.281 20.159 17.686 23.066C383.204 100.434 440 171.518 440 256c0 101.689-82.295 184-184 184-101.689 0-184-82.295-184-184 0-84.47 56.786-155.564 134.312-177.219C216.719 75.874 224 66.517 224 55.712V39.064c0-15.709-14.834-27.153-30.046-23.234C86.603 43.482 7.394 141.206 8.003 257.332c.72 137.052 111.477 246.956 248.531 246.667C393.255 503.711 504 392.788 504 256c0-115.633-79.14-212.779-186.211-240.236C302.678 11.889 288 23.456 288 39.056z"/></svg></span> It has an entire ecosystem ] .pull-right[ <img src="img/tidyverse.PNG" width="650px" height="400px" style="display: block; margin: auto;" /> ] .footnote[Source: [rviews](https://rviews.rstudio.com/2017/06/08/what-is-the-tidyverse/)] --- # Tidy Evaluation .center[ If a vector/variable exists within a data frame (or tibble) there are two ways **base R** gives you to work with that variable ``` # A tibble: 3 x 3 id test_score grade_level <dbl> <dbl> <dbl> 1 123 350 3 2 234 380 4 3 345 290 3 ``` ] .pull-left[ 1. Standard Evaluation ```r sch_data[["test_score"]] ``` ``` [1] 350 380 290 ``` ```r sch_data[ , 2] ``` ```r sch_data[ , "test_score"] ``` ] .pull-right[ 2\. Non-standard Evaluation ```r sch_data$test_score ``` ``` [1] 350 380 290 ``` ] --- # Tidy Evaluation .center[In comes, a 3rd option, **tidy evaluation**.] .center[Tidy evaluation is a special type of non-standard evaluation used throughout the tidyverse.] .pull-left[ 3\. Tidy Evaluation - Data Masking & Tidy Selection ```r select(sch_data, test_score, grade_level) ``` ``` # A tibble: 3 x 2 test_score grade_level <dbl> <dbl> 1 350 3 2 380 4 3 290 3 ``` ] .pull-right[ Compare this to base R ```r sch_data[ , c("test_score", "grade_level")] ``` ``` # A tibble: 3 x 2 test_score grade_level <dbl> <dbl> 1 350 3 2 380 4 3 290 3 ``` ] --- # Tidy Evaluation .center[Filter our dataset to cases where **test_score** is greater than 300 and **grade_level** is 3] .pull-left[ Tidy Evaluation ```r filter(sch_data, test_score > 300 & grade_level == 3) ``` ``` # A tibble: 1 x 3 id test_score grade_level <dbl> <dbl> <dbl> 1 123 350 3 ``` ] .pull-right[ Base R ```r sch_data[sch_data$test_score > 300 & sch_data$grade_level == 3, ] ``` ``` # A tibble: 1 x 3 id test_score grade_level <dbl> <dbl> <dbl> 1 123 350 3 ``` ] --- # The Pipe Operator .pull-left[  ] .pull-right[ Without the pipe ```r sch_data <- read_csv("school_data.csv") sch_data2 <- select(sch_data, id, test_score) sch_data3 <- filter(sch_data2, test_score > 300) ``` With the pipe ```r sch_data <- read_csv("school_data.csv") %>% select(id, test_score) %>% filter(test_score > 300) ``` ] .footnote[Source: [magrittr package](https://magrittr.tidyverse.org/)] --- # The Pipe Operator .pull-left[ ```r data_frame %>% function1 %>% function2 %>% function3 %>% ``` ] .pull-right[ ```r use_this_data %>% then_do_this %>% then_do_something_else %>% then_do_another_thing ``` ] .center[ Objects you create in a step, can be used in later steps ```r sch_data %>% mutate(new_test_score = test_score + 200) %>% filter(new_test_score > 500) ``` ``` # A tibble: 2 x 4 id test_score grade_level new_test_score <dbl> <dbl> <dbl> <dbl> 1 123 350 3 550 2 234 380 4 580 ``` ] ----- <style> .purple{ color: purple; } </style> .center[.purple[SIDE NOTE: There is a new native pipe operator that looks like this `**|>**`]] --- class: inverse, middle, center # Data Cleaning Functions --- # Files for Today .left-column[ In our practice folder we have: 1. .R "install packages" syntax file 1. 4 .R "example functions" syntax files with pre-filled code 1. data dictionary 1. .csv data file 1. .xlsx data file 1. .sav data file ] .right-column[ Data Files are 5 x 6 <table class="table table-striped" style="margin-left: auto; margin-right: auto;"> <thead> <tr> <th style="text-align:left;"> SurveyDate </th> <th style="text-align:right;"> id </th> <th style="text-align:right;"> consent </th> <th style="text-align:left;"> dist_sch_name </th> <th style="text-align:right;"> degree </th> <th style="text-align:left;"> yrs teach </th> </tr> </thead> <tbody> <tr> <td style="text-align:left;"> 2022-05-15 </td> <td style="text-align:right;"> 1234 </td> <td style="text-align:right;"> 1 </td> <td style="text-align:left;"> Kirkwood - Nipher Middle School </td> <td style="text-align:right;"> 1 </td> <td style="text-align:left;"> 5 yrs </td> </tr> <tr> <td style="text-align:left;"> 2022-05-15 </td> <td style="text-align:right;"> 1234 </td> <td style="text-align:right;"> NA </td> <td style="text-align:left;"> </td> <td style="text-align:right;"> NA </td> <td style="text-align:left;"> </td> </tr> <tr> <td style="text-align:left;"> 2022-05-16 </td> <td style="text-align:right;"> 1235 </td> <td style="text-align:right;"> 1 </td> <td style="text-align:left;"> Webster - Webster Groves High School </td> <td style="text-align:right;"> 2 </td> <td style="text-align:left;"> 4 </td> </tr> <tr> <td style="text-align:left;"> 2022-05-17 </td> <td style="text-align:right;"> 1236 </td> <td style="text-align:right;"> 1 </td> <td style="text-align:left;"> Kirkwood - Nipher Middle </td> <td style="text-align:right;"> 6 </td> <td style="text-align:left;"> 1 year </td> </tr> <tr> <td style="text-align:left;"> 2022-05-17 </td> <td style="text-align:right;"> 1237 </td> <td style="text-align:right;"> 2 </td> <td style="text-align:left;"> </td> <td style="text-align:right;"> NA </td> <td style="text-align:left;"> </td> </tr> </tbody> </table> ] --- class: center, inverse # Data Dictionary 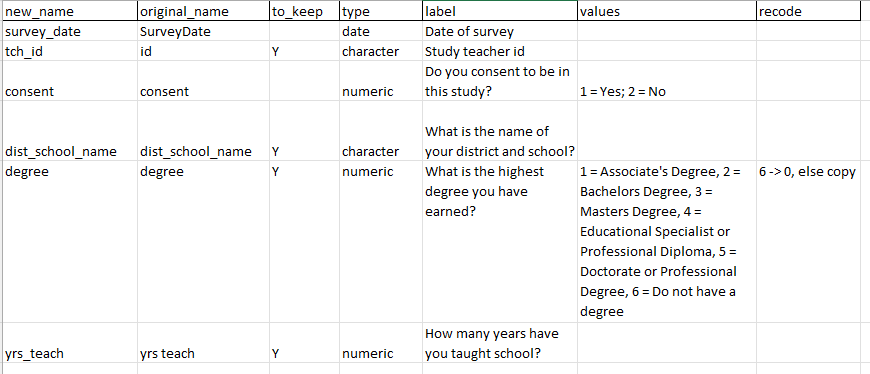 --- # Functions for Data Cleaning .pull-left[ **Read in data** |Task | Package | Function | |-----|---------|----------| |read in csv file | readr | read_csv | |read in xlsx file | readxl | read_excel | |read in sav file | haven | read_sav | **Set relative path** |Task | Package | Function | |-----|---------|----------| |check working directory | base | getwd | |set relative path | here | here | |set relative path | fs | path | ] .pull-right[ **Rename variables** |Task | Package | Function | |---------|-----------|-----------| |rename variables | dplyr | rename | |rename all variables | purrr | set_names| |modify variable names | dplyr | rename_with | **Review data** |Task | Package | Function | |-----|---------|----------| |review data structure | base |str| |transposed printed data | dplyr | glimpse | |summarize data | base | summary | |table variables | janitor | tabyl| ] --- # Read in Data .panelset[ .panel[.panel-name[read_csv] ```r read_csv(file = "file_name.csv", skip = 1, col_names = TRUE, na = "-99") ``` * file = file name (including path if necessary) as a string * skip = Number of lines to skip before reading in data * col_names = Either TRUE or FALSE, if TRUE the first row of the input will be used as column names. If FALSE, column names will be generated automatically: X1, X2, X3, etc. * na = Character vector of strings to interpret as missing values ] .panel[.panel-name[read_excel] ```r read_excel(path = "file_name.xlsx", sheet = "Sheet 1", skip = 1, col_names = TRUE, na = "-99") ``` * path = file name (including path if necessary) as a string * sheet = Sheet to read. Either a string (name of sheet), or an integer (position of sheet). * skip = Minimum number of rows to skip before reading anything * col_names = Either TRUE or FALSE, TRUE to use the first row as column names, FALSE to get default names * na = Character vector of strings to interpret as missing values. By default readxl treats blanks cells as missing. ] .panel[.panel-name[read_sav] ```r read_sav(file = "file_name.sav", skip = 1, user_na = TRUE) ``` * file = file name (including path if necessary) as a string * skip = Number of lines to skip before reading data * user_na = Either TRUE or FALSE, if TRUE variables with user defined missing values will be read in as labelled objects. If FALSE, user-defined missing values will be converted to NA. ] ] --- # Create Absolute Paths .pull-left[ When you open your syntax file to read in your data, if your working directory is not set to where your data file is, you will need to designate a path for your computer to find your data file. You can find your working directory by typing `getwd()` in your console ```r getwd() ``` ```r "C:/Users/Crystal/Desktop/ schoen_example_files" ``` ] .pull-right[ In R, paths should be created with "/" - Note this is different than the "\" that Windows uses For example, an absolute path to my `tch_survey.csv` file: Windows: "C:\Users\Crystal\Desktop\schoen_example_files\ data\tch_survey.csv" R: "C:/Users/Crystal/Desktop/schoen_example_files/ data/tch_survey.csv" R: "C:\\\Users\\\Crystal\\\Desktop\\\schoen_example_files\\\ data\\\tch_survey.csv" ] --- # Create Relative Paths The problems with absolute paths include: 1. If you share files, other users will not have the same directory structure as you, so they will need to recreate the file path 2. If you alter your directory structure, you will need to rewrite your paths 3. If you copy and paste file paths from Windows, you will need to fix all of your backslashes - Some paths can be very long and this leaves a lot of room for error .center[In come "**relative paths**"] .pull-left[ 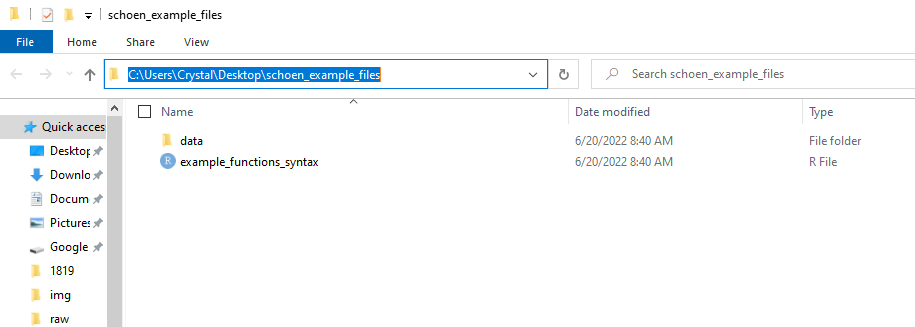 ] .pull-right[ "C:/Users/Crystal/Desktop/schoen_example_files" My relative path starts at the top of this working directory (or the root directory) `"./data/tch_survey.csv"` ] Source: [ExcelQuick](https://excelquick.com/r-programming/importing-data-absolute-and-relative-file-paths-in-r/) --- # Relative Paths .panelset[ .panel[.panel-name[here] ```r here() read_csv(file = here("data", "tch_survey.csv")) ``` `"C:/Users/Crystal/Desktop/schoen_example_files"` <br> If your file is outside of your working directory, you can navigate up using `..` * Ex: My data file is in "C:/Users/Crystal/Desktop/other_project/tch_survey.csv" I can go up one folder to the "Desktop" folder and then build my path from there ```r read_csv(file = here("..", "other_project", "tch_survey.csv")) ``` ] .panel[.panel-name[path] ```r path_wd() read_csv(file = path(".", "data", "tch_survey.csv")) ``` `"C:/Users/Crystal/Desktop/schoen_example_files"` <br> If your file is outside of your working directory, you can navigate up using `..` * Ex: My data file is in "C:/Users/Crystal/Desktop/other_project/tch_survey.csv" I can go up one folder to the "Desktop" folder and then build my path from there ```r read_csv(file = path("..", "other_project", "tch_survey.csv")) ``` ] ] --- # Name variables .panelset[ .panel[.panel-name[rename] Formula is `new name = old name` ```r data %>% rename(new_name = old_name) ``` If the old name has spaces in it, you need to surround the name in backticks ` ` ```r data %>% rename(tch_gender = x1, tch_race = `teacher race`) ``` ] .panel[.panel-name[set_names] The number of names must equal the number of variables in the data frame, in the same order Names must be in "" ```r data %>% set_names("new_name1", "new_name2", "new_name3") ``` ] .panel[.panel-name[rename_with] .pull-left[ ```r data %>% rename_with(~ function, variables) ``` * `~` = as a function of * function = any function you want to use to rename your variables * variables = any variables you want to rename with your function ] .pull-right[ A common function to include is `paste0` which is a base function This transformation below would add `_1819` to the end of variable names The `.` means paste my variable name **first**, then add my string. ```r data %>% rename_with(~ paste0(., "_1819"), c(variable1, variable2)) ``` ] ] ] --- # Review Data Data .panelset[ .panel[.panel-name[str] ```r data %>% str() ``` ``` tibble [5 x 6] (S3: tbl_df/tbl/data.frame) $ start_date : chr [1:5] "2022-05-15" "2022-05-15" "2022-05-16" "2022-05-17" ... $ tch_id : num [1:5] 1234 1234 1235 1236 1237 $ consent : num [1:5] 1 NA 1 1 2 $ dist_sch_name: chr [1:5] "Kirkwood - Nipher Middle School" "" "Webster - Webster Groves High School" "Kirkwood - Nipher Middle" ... $ degree : num [1:5] 1 NA 2 6 NA $ yrs_teach : chr [1:5] "5 yrs" "" "4" "1 year" ... ``` ] .panel[.panel-name[glimpse] ```r data %>% glimpse() ``` ``` Rows: 5 Columns: 6 $ start_date <chr> "2022-05-15", "2022-05-15", "2022-05-16", "2022-05-17", ~ $ tch_id <dbl> 1234, 1234, 1235, 1236, 1237 $ consent <dbl> 1, NA, 1, 1, 2 $ dist_sch_name <chr> "Kirkwood - Nipher Middle School", "", "Webster - Webste~ $ degree <dbl> 1, NA, 2, 6, NA $ yrs_teach <chr> "5 yrs", "", "4", "1 year", "" ``` ] .panel[.panel-name[summary] .pull-left[ ```r data %>% summary() ``` ] .pull-right[ ``` start_date tch_id consent dist_sch_name Length:5 Min. :1234 Min. :1.00 Length:5 Class :character 1st Qu.:1234 1st Qu.:1.00 Class :character Mode :character Median :1235 Median :1.00 Mode :character Mean :1235 Mean :1.25 3rd Qu.:1236 3rd Qu.:1.25 Max. :1237 Max. :2.00 NA's :1 degree yrs_teach Min. :1.0 Length:5 1st Qu.:1.5 Class :character Median :2.0 Mode :character Mean :3.0 3rd Qu.:4.0 Max. :6.0 NA's :2 ``` ] ] .panel[.panel-name[tabyl] .pull-left[ ```r data %>% tabyl(variable name) ``` ``` degree n percent valid_percent 1 1 0.2 0.3333333 2 1 0.2 0.3333333 6 1 0.2 0.3333333 NA 2 0.4 NA ``` ] .pull-right[ ```r data %>% tabyl(variable1, variable2) ``` ``` dist_sch_name 1 2 6 NA_ 0 0 0 2 Kirkwood - Nipher Middle 0 0 1 0 Kirkwood - Nipher Middle School 1 0 0 0 Webster - Webster Groves High School 0 1 0 0 ``` ] ] ] --- class: center, middle # <svg aria-hidden="true" role="img" viewBox="0 0 384 512" style="height:1em;width:0.75em;vertical-align:-0.125em;margin-left:auto;margin-right:auto;font-size:inherit;fill:#782F40;overflow:visible;position:relative;"><path d="M202.021 0C122.202 0 70.503 32.703 29.914 91.026c-7.363 10.58-5.093 25.086 5.178 32.874l43.138 32.709c10.373 7.865 25.132 6.026 33.253-4.148 25.049-31.381 43.63-49.449 82.757-49.449 30.764 0 68.816 19.799 68.816 49.631 0 22.552-18.617 34.134-48.993 51.164-35.423 19.86-82.299 44.576-82.299 106.405V320c0 13.255 10.745 24 24 24h72.471c13.255 0 24-10.745 24-24v-5.773c0-42.86 125.268-44.645 125.268-160.627C377.504 66.256 286.902 0 202.021 0zM192 373.459c-38.196 0-69.271 31.075-69.271 69.271 0 38.195 31.075 69.27 69.271 69.27s69.271-31.075 69.271-69.271-31.075-69.27-69.271-69.27z"/></svg> Let's Practice <svg aria-hidden="true" role="img" viewBox="0 0 384 512" style="height:1em;width:0.75em;vertical-align:-0.125em;margin-left:auto;margin-right:auto;font-size:inherit;fill:#782F40;overflow:visible;position:relative;"><path d="M202.021 0C122.202 0 70.503 32.703 29.914 91.026c-7.363 10.58-5.093 25.086 5.178 32.874l43.138 32.709c10.373 7.865 25.132 6.026 33.253-4.148 25.049-31.381 43.63-49.449 82.757-49.449 30.764 0 68.816 19.799 68.816 49.631 0 22.552-18.617 34.134-48.993 51.164-35.423 19.86-82.299 44.576-82.299 106.405V320c0 13.255 10.745 24 24 24h72.471c13.255 0 24-10.745 24-24v-5.773c0-42.86 125.268-44.645 125.268-160.627C377.504 66.256 286.902 0 202.021 0zM192 373.459c-38.196 0-69.271 31.075-69.271 69.271 0 38.195 31.075 69.27 69.271 69.27s69.271-31.075 69.271-69.271-31.075-69.27-69.271-69.27z"/></svg> --- # Functions for Data Cleaning .pull-left[ **Find and remove duplicates** |Task | Package | Function | |-----|---------|----------| |find duplicates| janitor | get_dupes | |remove duplicates | dplyr | distinct | **Filter data** |Task | Package | Function | |-----|---------|----------| |filter rows of data | dplyr | filter | ] .pull-right[ **Select variables** |Task | Package | Function | |-----|---------|----------| |select variables | dplyr | select | **Create new variables** |Task | Package | Function | |-----|---------|----------| |create new variable|dplyr | mutate| ] --- # Remove duplicates .panelset[ .panel[.panel-name[find-duplicates] An example identifier variable would be a student or teacher id ```r data %>% get_dupes(identifier variable/s) ``` ``` # A tibble: 2 x 7 tch_id dupe_count start_date consent dist_sch_name degree yrs_t~1 <dbl> <int> <chr> <dbl> <chr> <dbl> <chr> 1 1234 2 2022-05-15 1 "Kirkwood - Nipher Middle~ 1 "5 yrs" 2 1234 2 2022-05-15 NA "" NA "" # ... with abbreviated variable name 1: yrs_teach ``` ] .panel[.panel-name[remove-duplicates] .pull-left[ ```r data %>% distinct(identifier variable/s, .keep_all = TRUE) ``` * .keep_all = TRUE means that I want to keep all of my variables in the data Using distinct will keep the first instance and drop all remaining duplicates. Depending on how your data is organized, this may not be what you want. ] .pull-right[ Consider using the `arrange` function from the `dplyr` package to arrange the data how you want before dropping the duplicates For example, if date was collected, you may want to arrange by descending date to keep the most recent case ```r data %>% arrange(tch_id, desc(date)) %>% distinct(tch_id, .keep_all = TRUE) ``` ] ] ] --- # Filter data .panelset[ .panel[.panel-name[filter-operators] .pull-left[ Filtering/Comparison operators include - `>` - `<` - `>=` - `<=` - `==` - `!` or `!=` - `%in%` - `between` ] .pull-right[ Logical operators used to filter on multiple columns: |Operator|Meaning | |--------|-----------------| | | | AND/OR | | & | AND | | , | AND | | xor | OR (not both) | ] ] .panel[.panel-name[filter-numeric] .pull-left[ ```r data %>% filter(logical expression) ``` ] .pull-right[ Here you would use a variable in your data and a comparison operator ```r data %>% filter(numeric variable == 1) ``` ```r data %>% filter(numeric variable >= 50) ``` ] ] .panel[.panel-name[filter-character] .pull-left[ I can also filter on non-numeric variables ```r data %>% filter(logical expression) ``` ] .pull-right[ ```r data %>% filter(character variable == "some string") ``` ```r data %>% filter(character variable %in% c("some string", "some other string")) ``` ] ] .panel[.panel-name[filter-na] I can filter based on NA values The function `is.na` is a base function that returns either TRUE or FALSE which the filter function uses to determine who to filter on ```r data %>% filter(!is.na(variable)) ``` ] .panel[.panel-name[filter-multiple-vars] I can also filter using multiple variables ```r data %>% filter(variable1 == 1 & variable2 == 5) ``` ```r data %>% filter(variable1 == "some text" | variable2 == "other text") ``` ] ] --- # Select Variables .panelset[ .panel[.panel-name[select-to-keep] You can either select the variables you want to keep ```r data %>% select(variable1:variable3) ``` ```r data %>% select(variable1, variable2, variable3) ``` ] .panel[.panel-name[select-to-remove] Or select the variables you want to remove (using "-") ```r data %>% select(-variable4) ``` ```r data %>% select(-c(variable4, variable5, variable6)) ``` ] .panel[.panel-name[select-with-tidy-select] You can also select variables using selection helpers. These include: `starts_with`, `ends_with`, and `contains`. ```r data %>% select(contains("bmtl")) ``` ```r data %>% select(ends_with("_1819")) ``` ] ] --- # Create new variables .pull-left[ Any time you want to create a new variable within a data frame, you use `mutate` This may be creating an entirely new variable or it may be recalculating, transforming, or recoding an existing variable ```r data %>% mutate(new variable name = a constant or some expression) ``` * `new variable name` = this can either be a completely new name, or you can use an existing name and write over the existing variable ] .pull-right[ ```r data %>% mutate(cohort = 1) ``` ```r data %>% mutate(age_months = age_years*12) ``` ```r data %>% mutate(sch_name = recode( sch_name, `nipher middle school` = "Nipher Middle")) )) ``` ] --- class: center, middle # <svg aria-hidden="true" role="img" viewBox="0 0 384 512" style="height:1em;width:0.75em;vertical-align:-0.125em;margin-left:auto;margin-right:auto;font-size:inherit;fill:#782F40;overflow:visible;position:relative;"><path d="M202.021 0C122.202 0 70.503 32.703 29.914 91.026c-7.363 10.58-5.093 25.086 5.178 32.874l43.138 32.709c10.373 7.865 25.132 6.026 33.253-4.148 25.049-31.381 43.63-49.449 82.757-49.449 30.764 0 68.816 19.799 68.816 49.631 0 22.552-18.617 34.134-48.993 51.164-35.423 19.86-82.299 44.576-82.299 106.405V320c0 13.255 10.745 24 24 24h72.471c13.255 0 24-10.745 24-24v-5.773c0-42.86 125.268-44.645 125.268-160.627C377.504 66.256 286.902 0 202.021 0zM192 373.459c-38.196 0-69.271 31.075-69.271 69.271 0 38.195 31.075 69.27 69.271 69.27s69.271-31.075 69.271-69.271-31.075-69.27-69.271-69.27z"/></svg> Let's Practice <svg aria-hidden="true" role="img" viewBox="0 0 384 512" style="height:1em;width:0.75em;vertical-align:-0.125em;margin-left:auto;margin-right:auto;font-size:inherit;fill:#782F40;overflow:visible;position:relative;"><path d="M202.021 0C122.202 0 70.503 32.703 29.914 91.026c-7.363 10.58-5.093 25.086 5.178 32.874l43.138 32.709c10.373 7.865 25.132 6.026 33.253-4.148 25.049-31.381 43.63-49.449 82.757-49.449 30.764 0 68.816 19.799 68.816 49.631 0 22.552-18.617 34.134-48.993 51.164-35.423 19.86-82.299 44.576-82.299 106.405V320c0 13.255 10.745 24 24 24h72.471c13.255 0 24-10.745 24-24v-5.773c0-42.86 125.268-44.645 125.268-160.627C377.504 66.256 286.902 0 202.021 0zM192 373.459c-38.196 0-69.271 31.075-69.271 69.271 0 38.195 31.075 69.27 69.271 69.27s69.271-31.075 69.271-69.271-31.075-69.27-69.271-69.27z"/></svg> --- # Functions for Data Cleaning .pull-left[ **Edit strings in variables** |Task | Package | Function | |-----|---------|----------| |remove strings | stringr | str_remove_all | |replace strings | stringr | str_replace_all | **Change class** |Task | Package | Function | |-----|---------|----------| |change to numeric | base | as.numeric | |change to character| base | as.characater| |change to date|lubridate|several functions| ] .pull-right[ **Split variables** |Task | Package | Function | |-----|---------|----------| |separate into more than one variable | tidyr | separate | **Recode variables** |Task | Package | Function | |-----|---------|----------| |recode a variable|dplyr | recode| |conditional function to regroup/recode a variable|dplyr|case_when| |conditional function to regroup/recode a variable|dplyr|if_else ] --- # Edit Strings in Variables .panelset[ .panel[.panel-name[str_remove] .pull-left[ This function is used to remove strings in variables ```r data %>% mutate(new variable name = str_remove_all(variable, pattern)) ``` * variable = the variable that has the string/s we want to remove * pattern = any pattern you want removed from a variable (could be words, symbols, or numbers) ] .pull-right[ The pattern must be in quotes ```r data %>% mutate(variable1 = str_remove_all( variable1, pattern = "$")) ``` ] ] .panel[.panel-name[str_replace] .pull-left[ This function is used to replace strings in variables ```r data %>% mutate(new variable name = str_replace_all( variable, pattern, replacement)) ``` * variable = the variable that has the string/s we want to replace * pattern = any pattern you want to replace in a variable * replacement = what you want to replace the pattern with ] .pull-right[ The pattern and replacement must be in quotes ```r data %>% mutate(variable1 = str_replace_all( variable1, pattern = "yr", replacement = "YEAR")) ``` ] ] ] --- # Change class .panelset[ .panel[.panel-name[class-numeric] ```r data %>% mutate(new variable = as.numeric(character variable)) ``` Note: If your character variable still has character values in it (letters, symbols, spaces), those values will be coded to NA when you change the class to numeric. You should deal with those values before recoding to numeric. ] .panel[.panel-name[class-character] ```r data %>% mutate(new variable = as.character(numeric variable)) ``` ] .panel[.panel-name[class-date] .pull-left[ `lubridate` has many functions to deal with character variables whose class needs to be date. A few of those include: `mdy()` : The character variable is in the format of month-day-year `ymd()` : The character variable is in the format of year-month-day `dmy()` : The character variable is in the format of day-month-year ] ```r data %>% mutate(new variable = function(character date)) ``` If our character date variable had values like "03-22-2022" then we could use `mdy()` ```r data %>% mutate(date = mdy(date)) ``` ``` # A tibble: 2 x 1 date <date> 1 2022-03-22 2 2022-04-15 ``` ] ] --- # Split Variables .pull-left[ Sometimes a variable contains more than one piece of information and needs to be split into 2 or more variables ```r data %>% separate(variable, into, sep) ``` * into = what will the new variable names be after your variable is split * sep = what separates the pieces of information The default is to remove the input column after separating. If you do not want this, you can add the argument `remove = FALSE` ] .pull-right[ ```r data %>% separate(city_state, into = c("city", "state"), sep = ",") ``` ] --- # Recode Variables .panelset[ .panel[.panel-name[recode] .pull-left[ The formula for `recode` is `old value = new value` The old value is a named value. If it is a number it needs to be surrounded in backticks. Any value you do not recode will be copied over as is. ```r data %>% mutate(new variable = recode(variable, old value = new value)) ``` ] .pull-right[ ```r data %>% mutate(variable1_r = recode(variable1, `2` = 0)) ``` ```r data %>% mutate(variable2 = recode(variable2, f = "free", r = "reduced")) ``` ] ] .panel[.panel-name[case_when] .pull-left[ ```r data %>% mutate(new variable = case_when( condition ~ value, TRUE ~ value )) ``` * condition = a logical condition, usually comparing a variable to a value or another variable * `~` = "then replace with" * value = character, numeric, NA, date value, or an existing variable * `TRUE` = "if it doesn't meet the criteria already given then" ] .pull-right[ ```r data %>% mutate(school_name = case_when( school_name == "sch a" ~ "School A", school_name == "schoola" ~ "School A", TRUE ~ school_name ) ) ``` ] ] .panel[.panel-name[if_else] .pull-left[ ```r data %>% mutate(new variable = if_else(condition, true, false)) ``` * condition = a logical condition, usually comparing a variable to a value or another variable * true = if the condition is true, use this value * false = if the condition is false, use this value ] .pull-right[ ```r data %>% mutate(collapsed_variable = if_else(variable == 5, 0, 1)) ``` ] ] ] --- class: center, middle # <svg aria-hidden="true" role="img" viewBox="0 0 384 512" style="height:1em;width:0.75em;vertical-align:-0.125em;margin-left:auto;margin-right:auto;font-size:inherit;fill:#782F40;overflow:visible;position:relative;"><path d="M202.021 0C122.202 0 70.503 32.703 29.914 91.026c-7.363 10.58-5.093 25.086 5.178 32.874l43.138 32.709c10.373 7.865 25.132 6.026 33.253-4.148 25.049-31.381 43.63-49.449 82.757-49.449 30.764 0 68.816 19.799 68.816 49.631 0 22.552-18.617 34.134-48.993 51.164-35.423 19.86-82.299 44.576-82.299 106.405V320c0 13.255 10.745 24 24 24h72.471c13.255 0 24-10.745 24-24v-5.773c0-42.86 125.268-44.645 125.268-160.627C377.504 66.256 286.902 0 202.021 0zM192 373.459c-38.196 0-69.271 31.075-69.271 69.271 0 38.195 31.075 69.27 69.271 69.27s69.271-31.075 69.271-69.271-31.075-69.27-69.271-69.27z"/></svg> Let's Practice <svg aria-hidden="true" role="img" viewBox="0 0 384 512" style="height:1em;width:0.75em;vertical-align:-0.125em;margin-left:auto;margin-right:auto;font-size:inherit;fill:#782F40;overflow:visible;position:relative;"><path d="M202.021 0C122.202 0 70.503 32.703 29.914 91.026c-7.363 10.58-5.093 25.086 5.178 32.874l43.138 32.709c10.373 7.865 25.132 6.026 33.253-4.148 25.049-31.381 43.63-49.449 82.757-49.449 30.764 0 68.816 19.799 68.816 49.631 0 22.552-18.617 34.134-48.993 51.164-35.423 19.86-82.299 44.576-82.299 106.405V320c0 13.255 10.745 24 24 24h72.471c13.255 0 24-10.745 24-24v-5.773c0-42.86 125.268-44.645 125.268-160.627C377.504 66.256 286.902 0 202.021 0zM192 373.459c-38.196 0-69.271 31.075-69.271 69.271 0 38.195 31.075 69.27 69.271 69.27s69.271-31.075 69.271-69.271-31.075-69.27-69.271-69.27z"/></svg> --- # Functions for Data Cleaning .pull-left[ **Recode NAs** |Task | Package | Function | |-----|---------|----------| |recode to NA | dplyr | na_if | |recode NA to a value | tidyr | replace_na | **Add value labels** |Task | Package | Function | |-----|---------|----------| |add value labels | labelled | set_value_labels | |review value labels| labelled | val_labels| |add labelled missing values|labelled|set_na_values| |review missing value labels | labelled | na_values| ] .pull-right[ **Add variable labels** |Task | Package | Function | |-----|---------|----------| |add variable labels | labelled | set_variable_labels| |review variable labels | labelled | var_label | **Export data** |Task | Package | Function | |-----|---------|----------| |export csv | readr | write_csv| |export xlsx| openxlsx|write.xlsx| |export sav | haven | write_sav ] --- # Recode NA .panelset[ .panel[.panel-name[recode-to-na] .pull-left[ ```r data %>% na_if(value) ``` * value = the value you want to replace with NA This function as is will apply to the entire data frame ] .pull-right[ If you want to only apply this to certain variables, then you need to use the `across` function from `dplyr` to select variables ```r data %>% mutate(across(c(variable1, variable2, variable3), ~na_if(., -999))) ``` * `~` = as a function of * `.` = refer to the variables referenced earlier for where to replace with NAs ] ] .panel[.panel-name[replace-na] .pull-left[ ```r data %>% mutate(variable = replace_na( variable, value)) ``` <br> ```r data %>% mutate(iss = replace_na(iss, 0)) ``` ] .pull-right[ You can also replace NA values for multiple variables using the function `across` from the `dplyr` package. ```r data %>% mutate(across(variable1:variable10, ~ replace_na(., -999))) ``` * `~` = as a function of * `.` = refer to the variables referenced earlier for where to replace the NAs ] ] ] --- # Add Value Labels .panelset[ .panel[.panel-name[add-value-labels] .pull-left[ Value labels are helpful if you are exporting to a software that can support them, such as SPSS ```r data %>% set_value_labels( variable = c("label1" = value, "label2" = value)) ``` ```r data %>% set_value_labels( q1 = c( "no" = 0, "yes" = 1), q2 = c("no" = 0, "yes" = 1) ) ``` ] .pull-right[ You can review your value labels ```r data %>% val_labels() ``` ``` $q1 no yes 0 1 $q2 no yes 0 1 ``` ] ] .panel[.panel-name[set-missing-values] .pull-left[ Setting missing values are helpful if you are exporting to a program that can support them, like SPSS If you have missing values like -99 or -98, those will not be recognized as missing values in programs like SPSS unless you label them as missing values before exporting Be aware that R will not consider your labelled missing values as NA when conducting calculations ```r data %>% set_na_values(Variable = value) ``` ] .pull-right[ You can have one or more values labelled as missing ```r data %>% set_na_values(variable1 = c(-97, -98)) ``` You can review your missing value labels ```r data %>% na_values() ``` ``` $variable1 [1] -97 -98 $variable2 NULL ``` ] ] ] --- # Add Variable Labels Variable labels can be very helpful if you are exporting your data to a program that supports them, like SPSS ```r data %>% set_variable_labels(variable = "label") ``` You can review variable labels ```r data %>% var_label() ``` ``` $variable1 [1] "Why does my dog stare at me?" $variable2 [1] "Is my dog happy?" ``` --- # Export Data .panelset[ .panel[.panel-name[export-csv] ```r write_csv(object, file) ``` * object name = the final data frame or tibble to be exported * file = the path to write the file to (which includes the name and extension of your file) Same as when we imported data, if you are not exporting your file to your working directory, you will need to include your path in the file argument. ```r write_csv(data, here("data", "my-data-clean.csv")) ``` ] .panel[.panel-name[export-xlsx] ```r write.xlsx(object, file) ``` * object name = the final data frame or tibble to be exported * file = the path to write the file to (which includes the name and extension of your file) Same as when we imported data, if you are not exporting your file to your working directory, you will need to include your path in the file argument. ```r write.xlsx(data, here("data", "my-data-clean.xlsx")) ``` ] .panel[.panel-name[export-sav] ```r write_sav(object, path) ``` * object name = the final data frame or tibble to be exported * path = the path to write the file to (which includes the name and extension of your file) Same as when we imported data, if you are not exporting your file to your working directory, you will need to include your path in the file argument. Bonus: When you export labelled data to SPSS using `write_sav` it will export your variable and value labels as well as your missing values into the file ```r write_sav(data, here("data", "my-data-clean.sav")) ``` ] ] --- class: center, middle # <svg aria-hidden="true" role="img" viewBox="0 0 384 512" style="height:1em;width:0.75em;vertical-align:-0.125em;margin-left:auto;margin-right:auto;font-size:inherit;fill:#782F40;overflow:visible;position:relative;"><path d="M202.021 0C122.202 0 70.503 32.703 29.914 91.026c-7.363 10.58-5.093 25.086 5.178 32.874l43.138 32.709c10.373 7.865 25.132 6.026 33.253-4.148 25.049-31.381 43.63-49.449 82.757-49.449 30.764 0 68.816 19.799 68.816 49.631 0 22.552-18.617 34.134-48.993 51.164-35.423 19.86-82.299 44.576-82.299 106.405V320c0 13.255 10.745 24 24 24h72.471c13.255 0 24-10.745 24-24v-5.773c0-42.86 125.268-44.645 125.268-160.627C377.504 66.256 286.902 0 202.021 0zM192 373.459c-38.196 0-69.271 31.075-69.271 69.271 0 38.195 31.075 69.27 69.271 69.27s69.271-31.075 69.271-69.271-31.075-69.27-69.271-69.27z"/></svg> Let's Practice <svg aria-hidden="true" role="img" viewBox="0 0 384 512" style="height:1em;width:0.75em;vertical-align:-0.125em;margin-left:auto;margin-right:auto;font-size:inherit;fill:#782F40;overflow:visible;position:relative;"><path d="M202.021 0C122.202 0 70.503 32.703 29.914 91.026c-7.363 10.58-5.093 25.086 5.178 32.874l43.138 32.709c10.373 7.865 25.132 6.026 33.253-4.148 25.049-31.381 43.63-49.449 82.757-49.449 30.764 0 68.816 19.799 68.816 49.631 0 22.552-18.617 34.134-48.993 51.164-35.423 19.86-82.299 44.576-82.299 106.405V320c0 13.255 10.745 24 24 24h72.471c13.255 0 24-10.745 24-24v-5.773c0-42.86 125.268-44.645 125.268-160.627C377.504 66.256 286.902 0 202.021 0zM192 373.459c-38.196 0-69.271 31.075-69.271 69.271 0 38.195 31.075 69.27 69.271 69.27s69.271-31.075 69.271-69.271-31.075-69.27-69.271-69.27z"/></svg> --- # Function Conflicts There may be times with you have one or more packages loaded that contain functions of the same name. This can cause conflicts where you are using a function from the wrong package. ---- .pull-left[ Example: The function `summarize()` exists in 2 packages: 1. `plyr` 2. `Hmisc` Which package you are using depends on the order of how they were loaded. ] .pull-right[ To deal with this issue, you may sometimes see the use of `pkg::function` to be explicit about which package you want your function to come from. `Hmisc::summarize()` You can read more about this by typing `help("::")` in your console ] --- class: inverse, middle, center # Questions?