Data Cleaning Plan
Overview
Data cleaning or data wrangling is the process of organizing and transforming raw data into a dataset that can be easily accessed and analyzed. A data cleaning plan is a written proposal outlining how you plan to transform your raw data into the clean, usable data. This is different than a code file or even a pseudocode file in that there is no code or syntax in a data cleaning plan. It is just a plain text explanation of the transformations and checks you intend to implement on a raw data file. It can be saved in any format that works for you (text, markdown, etc.). You can even write it in a code file (ex: .R) through comments if you wish, and I often do, as long as reading your comments is not code or technical skills dependent. Anyone from a project coordinator to a programmer should be able to read and understand this file and provide feedback if needed. This plan is started prior to data cleaning, however, similar to every other piece of documentation, this is also a living document that will be updated as you obtain more knowledge.
An example of a very simplified cleaning plan:
Data cleaning plan for project-a student survey
- Import raw data
- Check structure (# of rows and cols)
- Check rows for duplicate participants or non-consented participants
who need to be removed
- Compare against a roster (participant tracking)
- Check columns against data dictionary
- Any additional variables not in data dictionary?
- Missing any variables?
- Check rows for duplicate participants or non-consented participants
who need to be removed
- Check variable classes
- Update classes as needed
- Rename variables according to data dictionary
- Recategorize open-ended variables d and f
- Reverse coded variable a, b, c
- Name new variables according to data dictionary
- Check reverse scoring
- Create sum and mean scores x, y, and z
- Name new variables according to data dictionary
- Add variable labels and value codes for all variables
- Run validation to check ranges of all variables
- Export clean data file
Foundation
In order to start a data cleaning plan, you need to have the following:
- Data literacy
- Domain knowledge
- Software knowledge
- Consultation with stakeholders
Data literacy
Data cleaning requires a solid foundation around data literacy, the ability to create, interpret, and communicate data as information. Without data literacy it is difficult to visualize how to transform the raw data you have into the format that you need to answer your questions.
While we hope data literacy and good data management permeates every step of the data lifecycle, including data collection, neat data is rarely handed to you, and oftentimes you are taking a file that is mostly unusable and converting it to something useful.
Here are ways to build data literacy, adapted from Venngage:
- Recognize that data errors are inevitable. Despite your best efforts to collect clean data, issues such as duplicate records, illegal values, or missing data still occur (Hubbard, 2017).
- Know the types of data you are working with (quantitative, qualitative)
- Understand the source of where your data comes from (primary data sources, secondary data sources) and also how data is created (aggregation, calculations, etc.)
- Keep your data organized (understand data structure)
- Know how to look for patterns and outliers in data, and be aware of your own biases.
- Use Exploratory Data Analysis (EDA) to validate data
- The more data you work with, the more you learn
📑 Additional resource on boosting data literacy
Domain knowledge
A lot of data literacy also relies on domain knowledge or ghost knowledge, information you only learn from being immersed in a field. Examples of domain knowledge I have acquired from being in the field of education research include:
If researchers tell me they are analyzing longitudinal data, I know I need to account for time in the data in some way (ex: add a time variable). If researchers are clustering data, I know I need to account for that cluster in the data in some way (ex: add a cohort variable). I know if we have multiple forms or forms across time, we have to link our data and I need to add a unique study id to link data.
There are school districts we work with that send us student level discipline data (ex: number of OSS or ISS referrals). They do not have codebooks or data dictionaries for these data. However, I know from working with these districts and having conversations with them, that if there are no referrals for a student, they leave a cell blank (rather than enter a zero). If I did not have this domain knowledge, I would assume the information is simply missing.
Similarly, I know from working with certain districts as well as state education agencies and having conversations with them, that how test scores are collected or scored have changed across years. Again, most of these agencies don’t usually have codebooks or data dictionaries but I have learned this through conversations and by noticing differences in score ranges over time.
Again, from working with districts and states, I know to prepare for inconsistencies in data. I’ve seen variable names change over time. I’ve also seen the variables collected change over time. And sometimes, across time, variables with the exact same name are no longer measuring the same thing (another reason why documentation is so important).
Software knowledge
I know what you may be thinking here. Earlier I said that the interpretation of a data cleaning plan should not require any technical knowledge. This is still true. However, the person who writes the data cleaning plan still needs to have a basic understanding of the software that is used to collect the data and any software that will be used to clean or analyze the data. This knowledge will inform the steps you add to a data cleaning plan.
Become familiar with the following:
- The tools used to collect data
- Is the data hand entered from paper forms?
- How is the data entered/exported? File type?
- What funky formatting things does that software do?
- Microsoft Excel loves to autocorrect numeric or character values to dates or autocorrect character numbers with leading 0s to numeric
- Is it online software?
- If yes, is the data exported? What file type is exported?
- Can you connect to the data through other means (ex: API)?
- How are values coded (numeric or words)?
- How are missing values coded?
- What are the additional variables this software adds to an export
file that we don’t need for our clean data?
- How are “select all” questions exported?
- For example I know when Qualtrics collects data from a “select all”
question
- the data will export in multiple columns like the question below where we asked, “Which tools do you use for remote teaching?”
- Yes will be coded as 1 and No will be exported as NAs
- For example I know when Qualtrics collects data from a “select all”
question
- Extract sample data to get a feel for all of this!
- If yes, is the data exported? What file type is exported?
- Is the data hand entered from paper forms?
| Q1_1 | Q1_2 | Q1_3 | Q1_4 |
|---|---|---|---|
| NA | 1 | NA | NA |
| NA | 1 | 1 | 1 |
| NA | NA | NA | NA |
| 1 | 1 | 1 | NA |
- What software are we using to clean the data?
- Is the software case sensitive?
- Does it have variable name character limits?
- Does it have other limitations on variable names (can’t start with a number, can’t contain a “-”)?
- What software do stakeholders plan to use to analyze the data? We
may not always know this, but if we do, we can try to accommodate this
- Is there a certain file type required for data import?
- For example, Mplus can only read ASCII text files
- What missing values are allowed
- Again with Mplus, it doesn’t allow blanks in a data file so all missing values need to be replaced with an actual value (ex: -99)
- With all this said, don’t just tailor your output clean file to a particular user. Depending on a users needs, you may export two clean files, one for that user and another general clean analysis file in a file type that will be accessible to anyone and is best for long term preservation. While we will talk more about this in later trainings around data sharing, non-proprietary data formats such as csv or txt are best.
- Is there a certain file type required for data import?
Consultation with stakeholders
While everything above is absolutely imperative to the data cleaning process, this may actual be the most important step in developing a data cleaning plan. If you don’t know a) how your data is collected, and b) how researchers plan to analyze the data, then you have no roadmap for data cleaning. This is where you learn things such as:
- The types of data you will be receiving (survey, observation, assessment)
- What format it will be in (csv, xlsx, spss)
- How reliable is the data (will it be hand entered, is it collected by your team, is it coming from an outside source)?
- What is the timeline? When should the data team expect to receive data? You can document this in a data cleaning timeline/data accounting spreadsheet.
- How do researchers intend to use the data?
- Do researchers want their final data in long or wide form?
- Do they need missing data coded in any specific way?
- What file format do they need?
- Any additional calculations or transformations that need to be done in the data?
- Any other secondary data sources they want brought in to enhance the data?
- What is the timeline for when researchers need clean data? You can document this in a data cleaning timeline/data accounting spreadsheet.
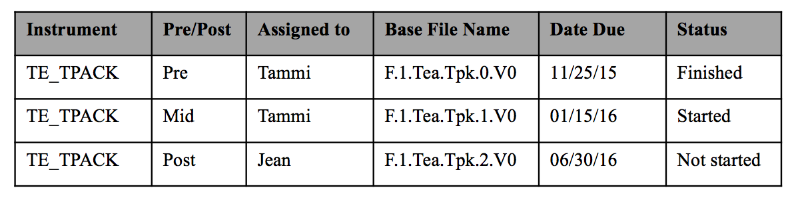
Source: Data accounting spreadsheet from Aleata Hubbard
This initial meeting with stakeholders, prior to data collection or even prior to building data collection tools, is a great time to start your documentation. This should not just be one initial meeting though. While the PIs may only need to be brought in at the beginning, a data manager should meet with the coordinators more frequently to monitor changes to the data collection instruments, any new measures added, changes in data collection protocol, or any unanticipated hiccups. Any updates should be documented in things such as protocols, codebooks, data dictionaries, or a data cleaning timeline. After data is cleaned, data teams should consider having data reviews with project coordinators to cover what data issues were encountered and what could the team have done better.
Data structure
Before we can start writing our data cleaning plan, we need to understand what structure we need our data to be in for analysis.
In the world of quantitative education research, we are most likely trying to create rectangular datasets (rows and columns) that are machine readable, rather than having data in text files (ex:pdf), video recordings, xml, etc. Even in qualitative research, we are often wrangling data to be in a format that is analyzable and allows categorization.
The two ways data will need to be structured for the field of education are wide or long. The simplest way to think about wide is that all data collected on a unique participant will be in one row. The easiest scenario to see this is with repeated measure data. If we collect a survey on participants in wave 1 and 2, those waves of data will all be in the same row (merged/joined together on a unique ID) and each wave of data collection will be appended to a variable name to create unique variable names.
| stu_id | w1_stress1 | w1_stress2 | w2_stress1 | w2_stress2 |
|---|---|---|---|---|
| 56987 | 3 | 4 | 2 | 3 |
| 54882 | 1 | 1 | 1 | 2 |
| 55574 | 2 | 1 | 4 | 1 |
In long data, a participant can repeat in your dataset. Again, the most straight forward way to think about this is with repeated measure data, where each row will be a new time point for a participant. This is often called appending data. In this scenario, we no longer need to append the data collection wave to variable names. However, we would need to add a time period variable to denote the wave associated with each row of data.
| stu_id | wave | stress1 | stress2 |
|---|---|---|---|
| 56987 | 1 | 3 | 4 |
| 56987 | 2 | 2 | 3 |
| 54882 | 1 | 1 | 1 |
| 54882 | 2 | 1 | 2 |
| 55574 | 1 | 2 | 1 |
| 55574 | 2 | 4 | 1 |
There are different reasons for constructing your data one way or another. For example, repeated measure procedures typically require data to be in wide format, where the unit of analysis is the subject. While mixed model procedures typically required data to be in long format, where the unit of analysis is each measurement for the subject.
The thing is, it is very easy to restructure data from one way to another. So my opinion is, the easiest way to manage data is to:
Don’t merge data until you have to. It is much simpler, in terms of data management and syntax writing, to keep variable names consistent over time.
Don’t append any time periods to variable names or add a time variable to your data until you have to (this can all be added very easily in your syntax). You will know what time period is associated with the data file based on the file name and storage location.
Once someone requests data or you need it for your own purposes, then you can add a time variable or append time to variable names as needed, and merge or append data across time. Just make sure to ask the requester what format they want their data in.
📑 The Analysis Factor has a great blog post on things to consider when choosing between long and wide format.
Merging across forms
Most of what I mentioned above refers to how to structure data over time. However, we also need to discuss how to merge disparate data sources within time. Most likely you will be collecting more than one piece of data from participants. You may have a survey and an assessment for instance. Within time, those forms will always be merged in wide format. You will link a participant’s survey data to their assessment data through the unique identifier you’ve give the participants and attached to each form.
Tidy data
I of course, cannot pass over the topic of tidy data here. The term is ubiquitous in the world of data wrangling, especially for those who use the R programming language. Tidy data, defined by Hadley Wickham, meets very specific conditions which are:
- Each variable forms a column
- Each observation forms a row
- Each type of observational unit forms a table
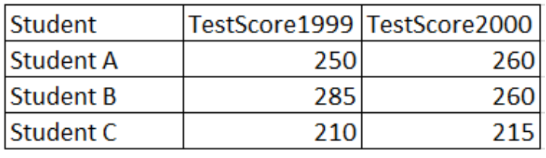
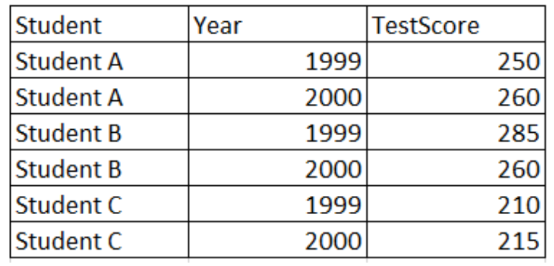
Essentially, tidy data are long format data.
| Not tidy data | Tidy data |
|---|---|
 |
 |
I think in education research, tidy data definitely has a time and place (for example in creating visualizations/graphs, and some analyses). And as I mentioned earlier, this is the most clean way to store your data since variable names aren’t repeating and changing based on things like time periods. However, I think what is most important is organizing your data in the rectangular format (rows and columns) that is necessary for your analysis. I also think it is important to follow some of the other guidelines set forth by Hadley Wickham, and also by Karl Broman and Kara Woo in their paper Data Organization in Spreadsheets.
Important guidelines to follow:
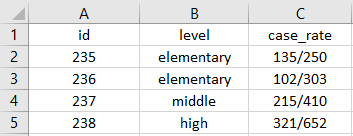
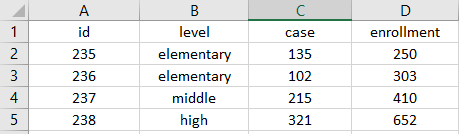
- Put just one thing in a cell
- Ex: If a rate column contains two numbers, cases/enrollment
- Split that column into two columns (cases and enrollment)
- Do not merge cells
| Two things one cell | Two things two cells |
|---|---|
 |
 |
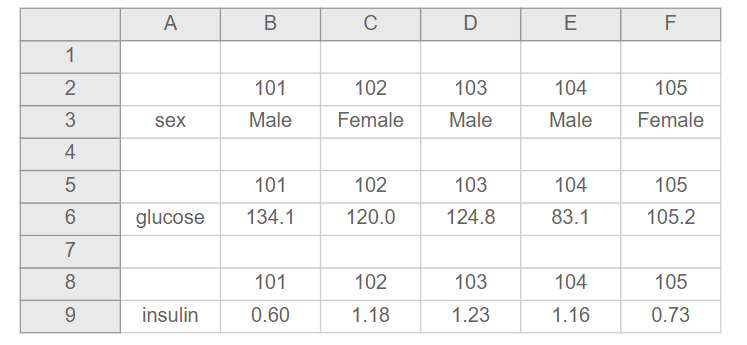
- Make your data a rectangle
- The first row of your data should be variable names (only one row for this)
- The remaining data should be rows and columns that correspond to subjects and variables
| Not rectangle | Rectangle |
|---|---|
 |
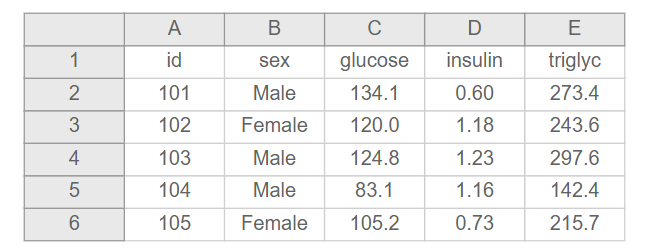 |
Just be prepared because while you may put in the planning to collect organized data, many of the secondary datasets you use may not be organized in a nice rectangle for you. But don’t worry! You can transform the dataset on the left into the one on the right with a little patience, planning, and code. You can find more examples of non-rectangular data from Karl Broman here.
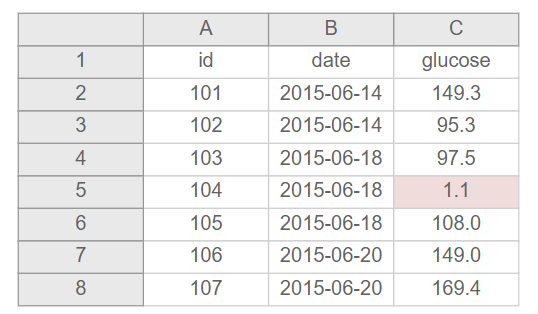
- Don’t use font color or highlighting as data
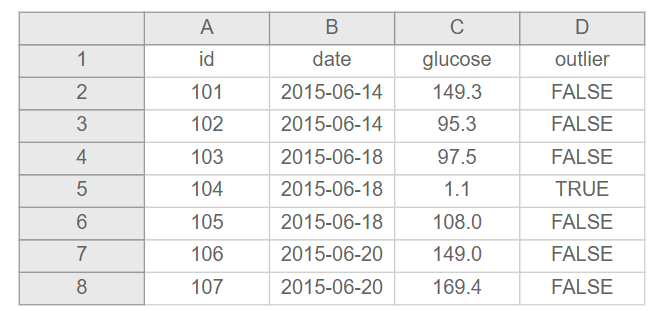
- If you want to flag data as suspicious, add a variable to indicate that
| Highlight | No highlight |
|---|---|
 |
 |
- Don’t leave empty cells
- If a cell is actually missing data, make sure it contains something to denote the absence of data (ex: NA) to show that the cell was not left blank unintentionally
- If a cell is empty because it is “implied” to be the same value as
above, fill that cell with the actual data
- If the value for that cell is implied to be zero, enter 0 so the user can differentiate between missing values and non-missing values that are simply zero
| Empty | Not empty |
|---|---|
Resources:
📑 Karl Broman
📑 R for Data
Science
📑 Tidy
Data
Final datasets
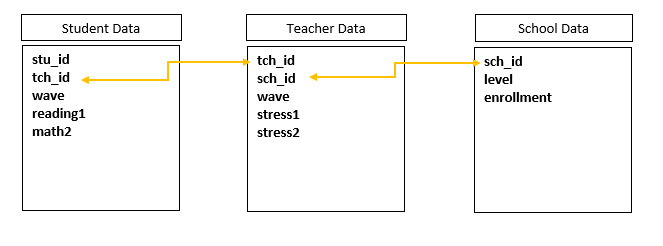
In the end, what you will most likely want is one dataset per participant entity (school dataset, teacher dataset, student dataset). And if you plan to link these together, you will need to make sure you are able to do that through your ID schema.
Data cleaning steps
Our role as data managers is not to think of every possible iteration of how an analyst/researcher may want their data or every variable they may need. However, it is our role to reduce the amount of work required to get that data into an analyzable format. Omar Elgarby wrote that “Quality data beats fancy algorithms”.
Clean data should be:
- Valid
- Accurate
- Complete
- Consistent
- Uniform
Below I lay out some of the go-to steps I like to add to a data cleaning plan and the reasoning behind why I think they are important.
Global rules
First, some global rules:
First rule: Never make edits to the raw data. You never know when you will make an error and need to return to the the original, uncorrected data file.
Resources:
📑 Effective
Data Management
📑 Psych
Technical Specification
Second rule: Keep everything (except variables that are identifying and completely unnecessary for project). Keep both item level and aggregated variables, recoded and original variables. Again, you never know which variables someone may need for their analysis.
Third rule: Always de-identify the clean/analysis data. First, ensure your study ID is in the data and is accurate, then remove all PII (name, SSN, email, DOB, school name, parent name, IP address, etc.).
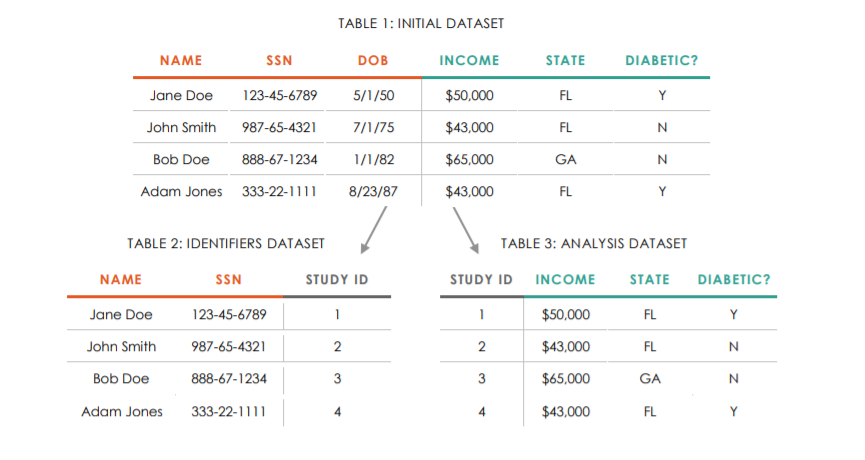
Source: J-PAL
Data cleaning steps
While this is not a comprehensive list of every possible data cleaning step you will need for your unique dataset and the questions your stakeholders need to answer, these are common steps that typically apply to all data in some way. You may need more or less steps depending on your data. Also, while these steps are presented in a logical order, they do not all need to happen in this order.
- Read raw data into a statistical program (ex: R, Stata, etc.)
- Your data may be one file from a folder on your computer, or multiple files, or you may be calling data from an API
- You will do all of your data cleaning for your file/s in a statistical program, never touching the raw data
- Review your data
- Rows, columns, values, missing data
- Check your number of cases against your participant tracking
- Check your columns against your data dictionary
- Remove any duplicate cases, cases who are not consented in your
study
- Check your protocol for removing duplicate responses
- If you are missing cases that are tracked as complete, work with the project coordinator to locate that data
- If you are supposed to de-identify data and your data does not already contain a study ID, read in a roster from your participant tracking and join your roster with your data
- Drop all unimportant columns (not in data dictionary) and any identifying columns (name, email, etc.)
- Split columns as needed
- Remember the rule, “Put just one things in a cell”
- If a column allowed people to indicate multiple responses, those responses may need to be split out into multiple columns or rows
- Remember the rule, “Put just one things in a cell”
- Rename columns to match your data dictionary
- Check variable classes/type and update as needed
- Convert string to numeric for example
- Transform/Normalize variables
- Remove symbols from columns such as % or $
- Remove white space from strings
- Standardize
- Make sure all of your variables are measured the same way within your dataset and the same way across time
- Rescale variables
- Collapse open ended variables into categorical variables
- Ex: school a, SchoolA, school b, School B –> School A, School B
- Recode variables
- If you know all missing values in a column are actual not missing and should be zero, recode NA to 0
- Reverse code likert scale variables
- Construct variables laid out in the data dictionary
- Create sum and mean scores
- Create standardized scores
- Collapse existing variable/s into a new variable
- Add variables such as cohort or treatment
- Add missing data values as needed
- Add your missing value schema (-99 = skipped, -98 = not applicable, etc.)
- Validate data
- Adding flags
can be helpful (columns that identify issues in a row)
- Flags for completed or partially completed measure (0 = complete, 1 = partial)
- Flag rows with issues (1 = issues, 0 = no issue)
- You can also create reports (ex: markdown documents) that report issues in the dataset
- Things to check for in your validation process
- Values out of range
- Boundaries of var1 is 0-10 and you find a 15
- Cross validation for impossible values
- age and grade level - a child age 8 says they are in grade 12
- Is the gender in one file, different than the gender in another file?
- Do any columns have homogeneous values (that shouldn’t)
- The variable cohort may contain all 1s, but a sum score variable should not contain all 2.5s (there should be variation in that column)
- Do the study IDs we have all fall within the list of IDs we have for
our study?
- This is a chance to check that an ID wasn’t entered incorrectly
- Values out of range
- Adding flags
can be helpful (columns that identify issues in a row)
- Transform data (wide to long or long to wide)
- Merge and/or append data as needed
- Across time, forms, data sources
- Again do validation checks, do you have the correct number of rows and columns after the merge?
- Add metadata
- Variable labels and value labels
- Export clean data to a specified format (.csv, .tsv, .xlsx, .sav,
etc.)
- Again, review recommendations for best formats for long-term data storage
Quick thought: Anonymous data
If you are collecting anonymous data, some of the steps above will
not apply to you:
1. You will not merge in a participant study ID except
maybe at the highest level of data collection (ex: your cluster level,
such as school or district ID).
2. You will not be able to drop duplicate cases (you
won’t know if you have duplicates in your data because you will have no
row level identifying information).
You will still however, need to de-identify data if you collected anything identifying such as school name or IP address.
You will also be limited in your data transformations:
1. You will not be able to merge disaggregated data in
wide format across time or forms because you will have no linking
participant ID. You can only append data in long form
because in long data, rows are stacked on top of each other and aligned
based on variable names (no unique participant ID is needed).
2. You can merge data across time or forms in wide
format if you aggregate and join your data to a level that you collected
such as school or district.
Resources:
📑 Aleata Hubbard has a blog post on six
data cleaning checks
📑 Jeff Leek also has a great blog
post on creating research quality datasets.
📑 An
Introduction to data cleaning with R
📑 The
Basics of Data Management
Reproducible syntax
Over the years I have seen researchers manually clean data in programs like Excel and in every scenario I can think of, it’s a bad idea because a) it is not reproducible, b) it leads to errors, and c) it is time consuming. My recommendation is to clean your data, no matter how small the task, with syntax (machine readable programming instructions written in a text editor that are processed by your computer). Even if you use a graphical user interface (GUI) program like SPSS (point and click), you need to log every move you make in that program and paste the code into a syntax file. Syntax files allow you to have a record of every transformation you make from the raw data to your clean data. While writing syntax may seem time consuming up front, it helps you to be more thoughtful in your data cleaning process and it can save you an enormous amount of time in the future if you plan to clean data with the same features multiple times (in say a longitudinal study).
You can use whatever program you want to write syntax (OpenRefine, R, Stata, SPSS, SAS, SQL, etc.). If you review the trainings available through Data Carpentry you’ll see that most of their data management workshops use SQL, OpenRefine, R, or Python (all open source).
If I haven’t sold you on using syntax yet, here are a few horror stories of manually cleaning data (based off of real life events):
1. A colleague is in charge of cleaning data for project-a. At the end of a data collection wave, the colleague sends you clean data. Yet when reviewing it you find three small errors in the data they send you.
- One variable had been named incorrectly
- One sum variable had been calculated incorrectly
- One variable was missing value labels
These all seemed like quick changes you could make very easily in a point and click interface, so you did. Then you saved that dataset as the final clean dataset. However, a month later, your colleague found an error in the data they sent you, and they send you a revised clean dataset.
This is the process you go through:
You did not document the changes you made to the prior dataset (either via syntax or even in a README_versioning file). Therefore, you had to do your best to remember what changes you had made to see if you needed to make them again, potentially leaving errors in the data if you forgot a step.
After checking the data and discovering that the changes you had previously made to the data had still not been corrected in this new file, you had to make all the changes to the new data again. This time, you write all the updates in syntax! This allows you to document your changes, as well as saves you from having to re-do all of your point and click work again in the future if you ever received another updated file. You can just run your syntax in a matter of seconds.
2. You download two Excel files that need to be appended (they have the same variables). In an attempt to move quickly, you decide to append the files by cutting all the rows from one file and pasting them below the rows of the other file. You then save this data as your complete dataset. At a later point when you are running some descriptive summaries on the data, you notice ranges for some of your variables are incorrect. You go back to your two original files (luckily you saved both original files as “raw” data). You do some detective work and discover that the order of the columns in each file are not identical so when you pasted data from one file to the other, the values did not correctly align. To correct this, you write syntax where you bind the two raw data files using a function that matches files based on column names.
3. A school district sends you a data file that you have requested. You know you only need this data for a one time report so you decide to start doing your manipulations in the raw data, by hand. You save this data, use it for your report, and then plan to never see it again. A year later, your coworker actually needs that data for another report. When that coworker starts digging around in the data, they find errors (values out of range and so forth). However, with no documentation of your changes, no syntax, and no raw data, there is no way to know how to fix the data. The data is rendered useless.
Resource: